
Geometric Terms and Centroid Concept in GeoGebra
Loading the math board and drawing, please wait…
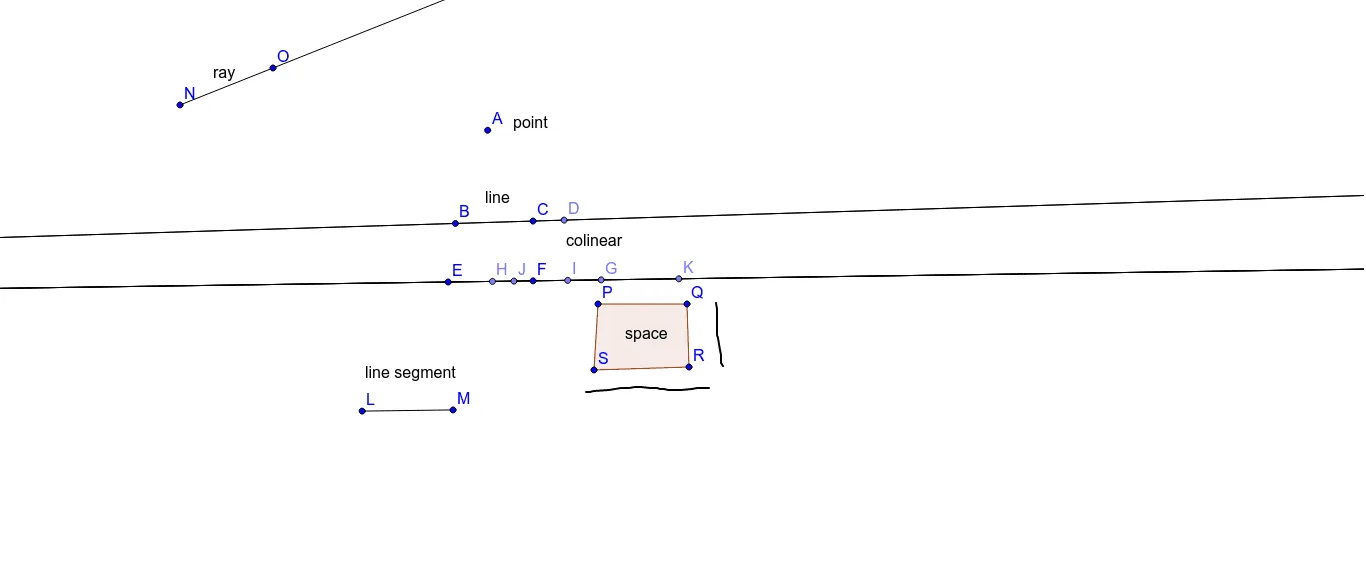
This example demonstrates how to draw geometric figures using GeoGebra and explain related terms. Key mathematical concepts include the centroid (Barycenter), fractions, probability, set theory, and differential equations. Construction involves commands like Line, Point, Segment, Ray, Polygon, and AttachCopyToView. Suitable for middle school students to understand geometric foundations and mathematical modeling.
GeoGebra Commands & Parameters
Line(B, C) → aPoint(a) → DLine(C, D) → bLine(E, F) → cPoint(c) → GPoint(c) → HLine(G, H) → dPoint(c) → IPoint(c) → JLine(I, J) → ePoint(c) → KLine(J, K) → fSegment(L, M) → gRay(N, O) → hPolygon(P, Q, R, S) → poly1, p, q, r, sAttachCopyToView(PolyLine[(5.0810865167835075, 1.729208244082292), (5.097821067150202, 1.6288009418821312), (5.097821067150202, 1.545128190048664), (5.097821067150202, 1.3777826863817295), (5.097821067150202, 1.2606408338148754), (5.097821067150202, 1.1937026323481017), (5.114555617516895, 1.1434989812480214), (5.148024718250282, 0.9426843768477), (5.164759268616975, 0.8590116250142327), (5.164759268616975, 0.7920734235474589), (5.164759268616975, 0.7251352220806851), (5.198228369350362, 0.6749315709806049), (NaN, NaN), (2.9055949691133507, 0.23983326144657519), (2.972533170580125, 0.23983326144657519), (3.039471372046899, 0.2565678118132686), (3.2904896275473017, 0.27330236217996207), (3.4913042319476237, 0.30677146291334895), (3.558242433414398, 0.30677146291334895), (3.625180634881172, 0.30677146291334895), (3.725587937081333, 0.3235060132800424), (3.825995239281494, 0.3235060132800424), (3.9766061925817358, 0.30677146291334895), (4.09374804514859, 0.30677146291334895), (4.143951696248671, 0.29003691254665553), (4.210889897715445, 0.29003691254665553), (4.277828099182219, 0.27330236217996207), (4.344766300648993, 0.27330236217996207), (4.411704502115767, 0.27330236217996207), (4.4953772539492345, 0.27330236217996207), (4.679457307982863, 0.29003691254665553), (4.763130059816331, 0.30677146291334895), (4.830068261283105, 0.30677146291334895), (4.897006462749879, 0.30677146291334895), (4.963944664216653, 0.30677146291334895), true], 1, (-6.900851545769048, -2.906262207491793), (15.95854425513429, 6.799777005190406), (0, 580), (1366, 0)) → stroke1
AI Drawing Prompt Reference
Draw a figure illustrating geometric terms and the centroid concept: create several intersecting lines, place multiple points on those lines, connect the points to form segments and a ray, add a quadrilateral, and finally include a polyline made of many coordinate points to show a curved trend. The construction begins with two base lines, then adds auxiliary lines through selected points, marks additional points on each line, draws a segment and a ray from designated vertices, constructs a four‑sided polygon, and finishes with a detailed polyline tracing a smooth curve across the view.
The prompt above was compiled from the original drawing commands and is for reference only.