
Geometric Probability Construction with Circles, Sectors and Vectors
Loading the math board and drawing, please wait…
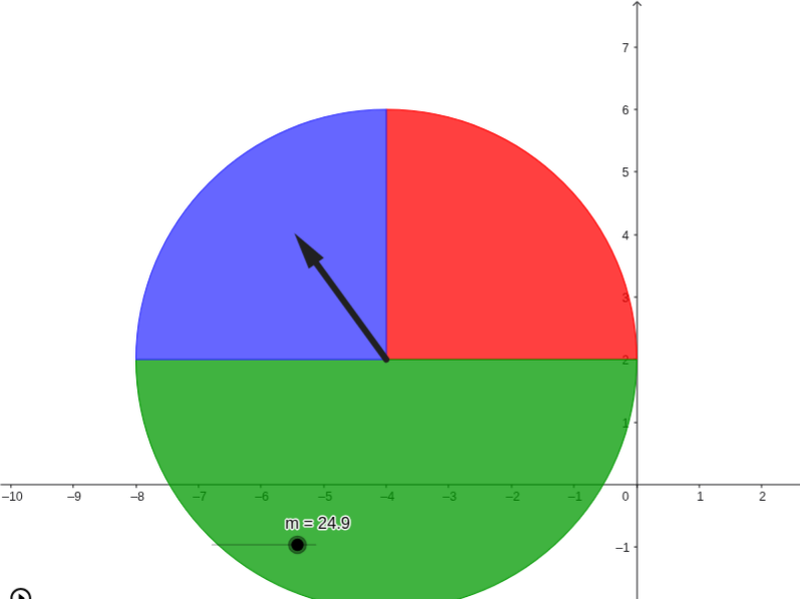
This example demonstrates a geometric probability construction based on circles, circle sectors, lines, intersections, rotations, and vectors in GeoGebra. It visually explains the geometric meaning of probability models through intersection points of circles and lines, rotated point positions, and sector area ratios. Core mathematical concepts covered include probability and statistics, plane geometry, vector operations, and circular sector area computation. The construction uses GeoGebra commands Circle (object c), Line (objects d, e, f), Intersect (points C, D, E, F), Rotate (points E′, E′′, C′, C′′), CircleSector (objects a, b), and Vector (objects u, v), together with auxiliary objects A, B, g, h, k, p, q, r, n, m, F′, D′, and pic1. It is suitable for high school mathematics instruction, classroom demonstrations, and student-centered exploration of geometric probability models.
GeoGebra Commands & Parameters
Circle(A, 4) → cCircle(B, 4) → dCircle(A, 2.5) → eCircle(B, 2.5) → fLine(B, yAxis) → aLine(A, yAxis) → bIntersect(d, a, 2) → CIntersect(f, a, 2) → DIntersect(c, b, 2) → EIntersect(e, b, 2) → FRotate(E, 240*°, A) → E'Rotate(E', 240*°, A) → E''CircleSector(A, E', E) → gCircleSector(A, E'', E') → hCircleSector(A, E, E'') → kRotate(C, 270*°, B) → C'Rotate(C', 180*°, B) → C''CircleSector(B, C', C) → pCircleSector(B, C'', C') → qCircleSector(B, C, C'') → rRotate(F, -((n * 360)°), A) → F'Rotate(D, -((m * 360)°), B) → D'Vector(B, D') → uVector(A, F') → v
AI Drawing Prompt Reference
Please draw a geometric probability diagram consisting of two concentric circles and two perpendicular lines. The circles have radii of 4 and 2.5, with centers at A and B. Draw two lines from A and B that intersect the y-axis. Find the intersection points of the circles with the lines, obtaining points C, D, E, and F. Rotate point E around A by 240 degrees to get E', then rotate E' around A by 240 degrees to get E''. Draw circular sector g with center A, arc from E' to E, and sector h with center A, arc from E'' to E'. Similarly, rotate point C around B by 270 and 180 degrees to get C' and C'', and draw sectors p, q, and r with center B. Finally, rotate points F and D around A and B respectively to get F' and D', and draw vectors u and v. The overall diagram illustrates the relationships of circles, sectors, rotations, and vectors in geometric probability, suitable for classroom demonstrations.
The prompt above was compiled from the original drawing commands and is for reference only.