
Geometric Mean 2.1: Dynamic Inequality Visualization
Loading the math board and drawing, please wait…
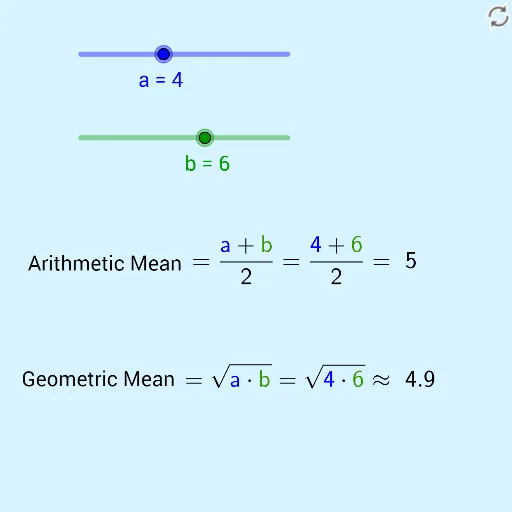
①This GeoGebra example dynamically demonstrates the relationship between the geometric mean (gm) and arithmetic mean (am) of two positive numbers a and b, visually confirming the classic inequality that the geometric mean is less than or equal to the arithmetic mean. ②Core mathematical concepts include geometric mean, arithmetic mean, inequalities, and comparisons with polynomial and power functions, with additional context from tangent functions and stochastic processes. ③Construction highlights: objects a and b serve as adjustable parameters, am and gm are computed, and text1/text2 display numerical values and the inequality; the graphical representation may include function plots or geometric constructions to aid understanding. ④Suitable for high school and above, this example is ideal for teaching algebra-geometry connections, inequality proofs, and as a preparatory tool for calculus or statistics.
GeoGebra Commands & Parameters
Numeric a(4)Numeric b(6)(a + b) / 2sqrt((a * b))
AI Drawing Prompt Reference
Create two adjustable positive numbers a and b, calculate and display their arithmetic mean and geometric mean, and show the relationship that the arithmetic mean is greater than or equal to the geometric mean. First, create two numeric sliders a and b, then calculate their arithmetic mean and geometric mean, and finally display these values in the graph, using geometric constructions or function plots to illustrate the inequality.
The prompt above was compiled from the original drawing commands and is for reference only.