
Geometric Illustration of Triangle Inequalities with Angles
Loading the math board and drawing, please wait…
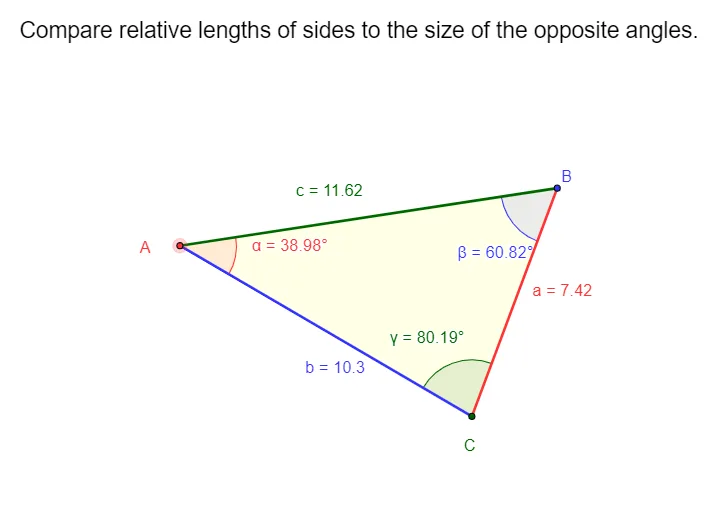
This example demonstrates triangle inequalities by constructing a triangle in the coordinate plane and visually relating side lengths and included angles to the key constraints (e.g., the sum of any two sides being greater than the third). It focuses on fundamental geometry concepts: triangle side-length inequalities, angle measurement, and using interactive geometric objects to observe when the inequality conditions hold. Construction details include creating the triangle using the GeoGebra command Polygon (points A, B, C form poly1) and labeling angles using the command Angle (angles α, β, γ), along with displaying measured side quantities (a, b, c) and explanatory text (text1). Suitable for middle to high school math instruction, classroom demonstrations, and geometry learning activities where students benefit from seeing inequalities represented through dynamic geometry.
GeoGebra Commands & Parameters
Polygon(A, B, C) → poly1, c, a, bAngle(C, A, B) → αAngle(A, B, C) → βAngle(B, C, A) → γ
AI Drawing Prompt Reference
Draw a triangle to illustrate triangle inequalities. The triangle is formed by three points A, B, and C. The side lengths are a, b, and c, and the angles are α, β, and γ at vertices A, B, and C. Highlight the condition that the sum of any two sides is greater than the third, and explain these relationships in text.
The prompt above was compiled from the original drawing commands and is for reference only.