
Geometric Dilation and Function Transformation
Loading the math board and drawing, please wait…
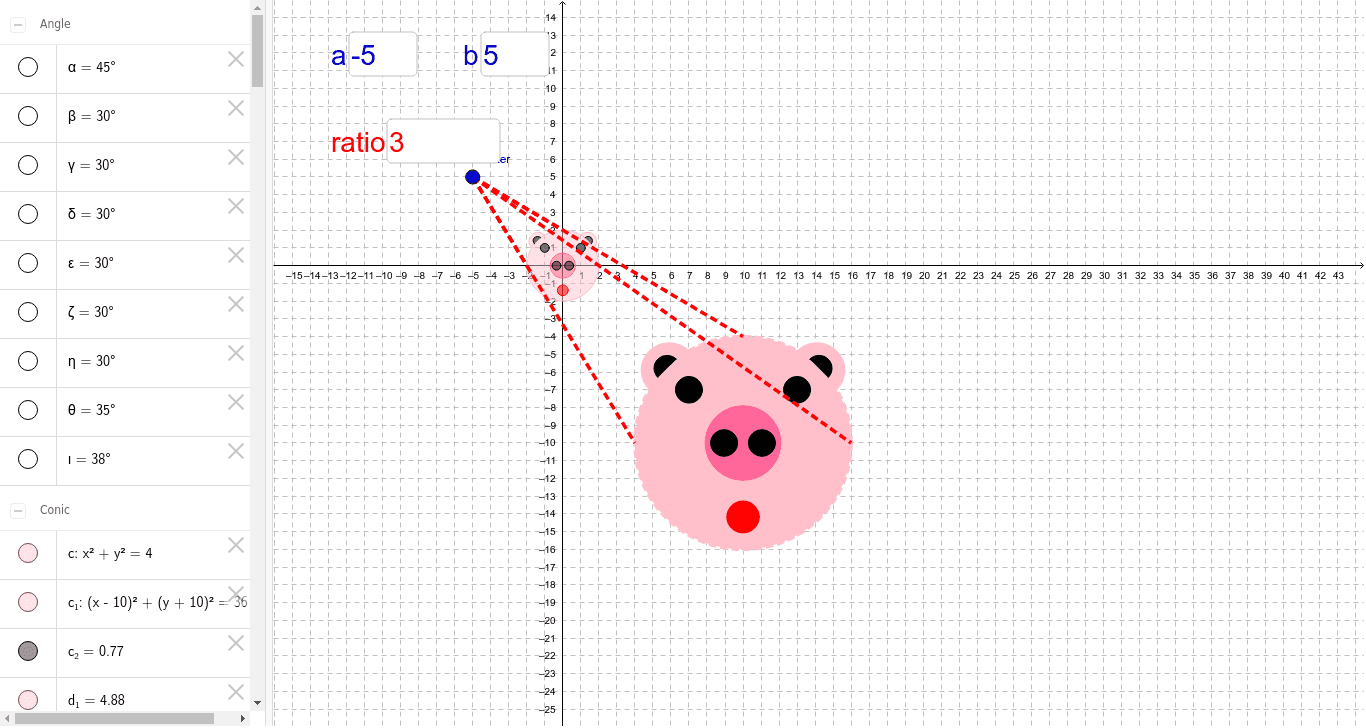
This example demonstrates how scaling operations affect the size and position of shapes and how function graphs change under scaling. Key mathematical concepts include geometric transformations, function graphs, and coordinate geometry. Construction involves GeoGebra commands such as Intersect, Rotate, Angle, Line, etc. It is suitable for middle or high school mathematics to understand scaling transformations and their impact on function graphs.
GeoGebra Commands & Parameters
Intersect(xAxis, yAxis) → APoint(yAxis) → BRotate(B, 45*°, A) → B'Angle(B, A, B') → αLine(A, B') → dMirror(E, yAxis) → E'Point(yAxis) → CCircle(A, C) → cRotate(C, 30*°, A) → mAngle(C, A, m) → βRotate(m, 30*°, A) → pAngle(m, A, p) → γRotate(A, 330*°, C) → A'Angle(A', C, A) → δRotate(C, 30*°, A) → C'_1Angle(C, A, C'_1) → εRotate(C, 330*°, A) → qAngle(q, A, C) → ζRotate(q, 330*°, A) → tAngle(t, A, q) → ηRotate(C, 35*°, A) → C'_3Angle(C, A, C'_3) → θRotate(C, 38*°, A) → nAngle(C, A, n) → ιMirror(n, f) → oMirror(o, yAxis) → sMirror(n, yAxis) → rMirror(A, yAxis) → A'_1Circle(E', 0.25) → eCircle(E, 0.25) → gCenter(c) → KPoint(yAxis) → LCircle(L, 0.3) → q_1Intersect(c, xAxis, 1) → F_2Circle(A_2, R_1) → c_1Circle(S_1, 0.25 * rr) → h_1Circle(Z_1, 0.25 * rr) → k_1Circle(A, 0.7) → hCenter(h) → FMidpoint(G, A) → HMirror(H, A) → H'Distance(A_2, B_2) → 거리A2B2Circumference(h) → 둘레hCircle(A_2, 0.7 * rr) → kCircle(B_2, 0.25 * rr) → p_1Circle(C_2, 0.25 * rr) → r_1Circle(E_2, 0.3 * rr) → s_1Textfield(rr) → 텍스트필드1Semicircle(p, m) → t_1Semicircle(o, n) → c_2Semicircle(q, t) → d_2Semicircle(r, s) → e_2Circle(H, 0.25) → f_2Circle(H', 0.25) → g_2Textfield(b) → 텍스트필드3Semicircle(O_1, R_1) → d_1Semicircle(P_1, Q_1) → e_1Semicircle(T_1, W_1) → f_1Semicircle(U_1, V_1) → g_1Intersect(c, yAxis, 1) → G_2Intersect(c, xAxis, 1) → H_2Intersect(c, xAxis, 2) → I_2Intersect(c, yAxis, 2) → J_2Segment(center, H_2) → iSegment(center, G_2) → jSegment(center, T_2) → b_1Segment(center, S_2) → l_1Textfield(a) → 텍스트필드2Segment(center, U_2) → l
AI Drawing Prompt Reference
Draw a geometric illustration showing dilation and function transformation. Start by plotting the coordinate axes and marking their intersection point. Create a point and rotate it around the intersection to form a line. Then, draw a circle and repeatedly rotate it around the intersection to create multiple circles. Finally, add several circles and points, adjusting their positions and sizes to demonstrate how scaling operations affect the size and position of shapes and how function graphs change under scaling.
The prompt above was compiled from the original drawing commands and is for reference only.