
Geometric and Logical Intersection: Analyzing Random Variables with Tree Diagram
Loading the math board and drawing, please wait…
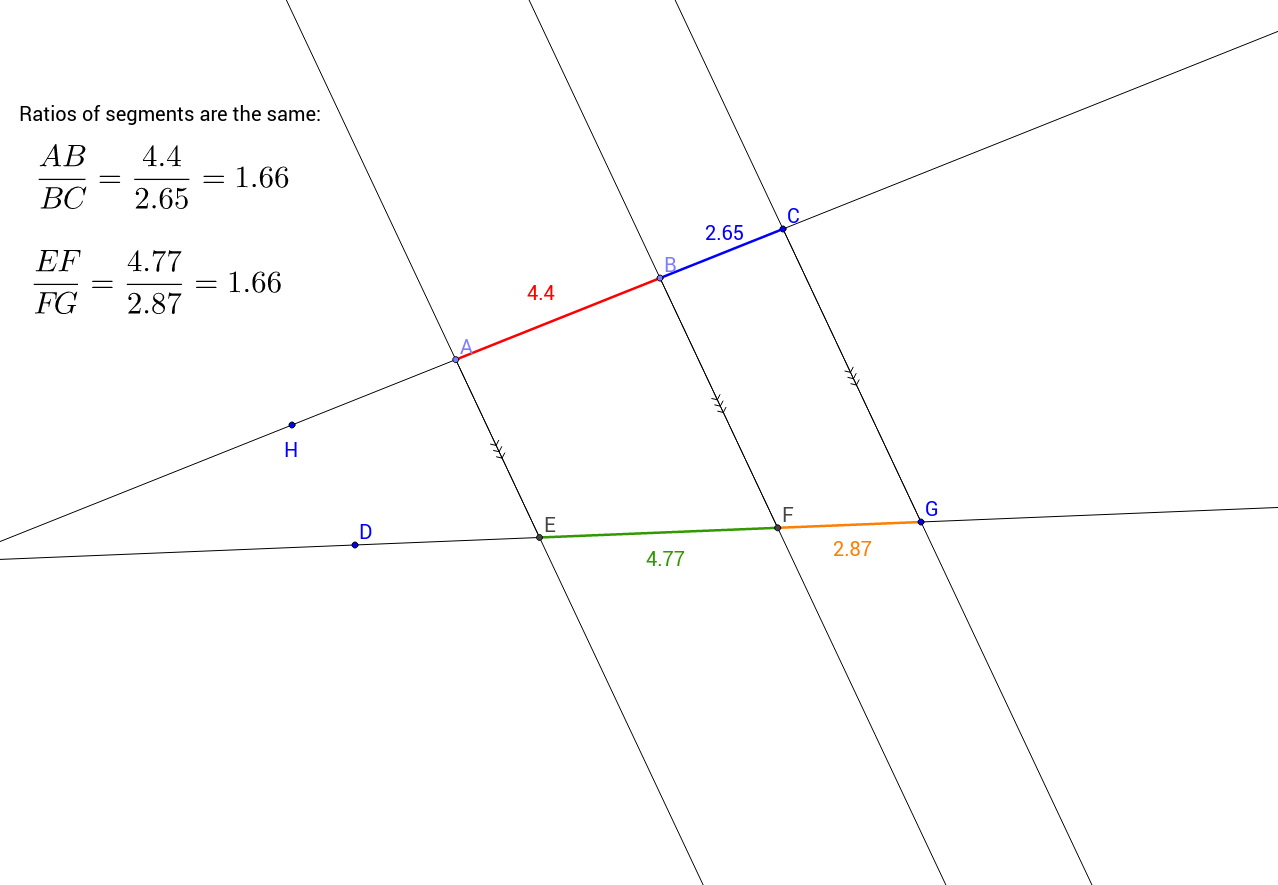
This example demonstrates how to use geometric figures and tree diagrams to analyze random variables. Key mathematical concepts include lines, rectangles, random variables, and logical reasoning. Construction involves GeoGebra commands like Line, Point, Intersect, and Segment. Suitable for middle or high school math teaching to understand the combination of geometry and probability.
GeoGebra Commands & Parameters
Line(C, G) → aLine(C, H) → bLine(G, D) → cPoint(b) → BPoint(b) → ALine(B, a) → dLine(A, a) → eIntersect(c, e) → EIntersect(c, d) → FSegment(C, B) → fSegment(B, A) → gSegment(G, F) → hSegment(F, E) → iSegment(A, E) → jSegment(B, F) → kSegment(C, G) → l
AI Drawing Prompt Reference
Draw two line segments intersecting at a point, then extend two line segments from the intersection point to intersect one of the original line segments, forming four intersection points. Connect these points to create multiple line segments, forming a geometric shape that illustrates the combination of geometry and probability.
The prompt above was compiled from the original drawing commands and is for reference only.