
GeoGebra Limit Function Construction Example
Loading the math board and drawing, please wait…
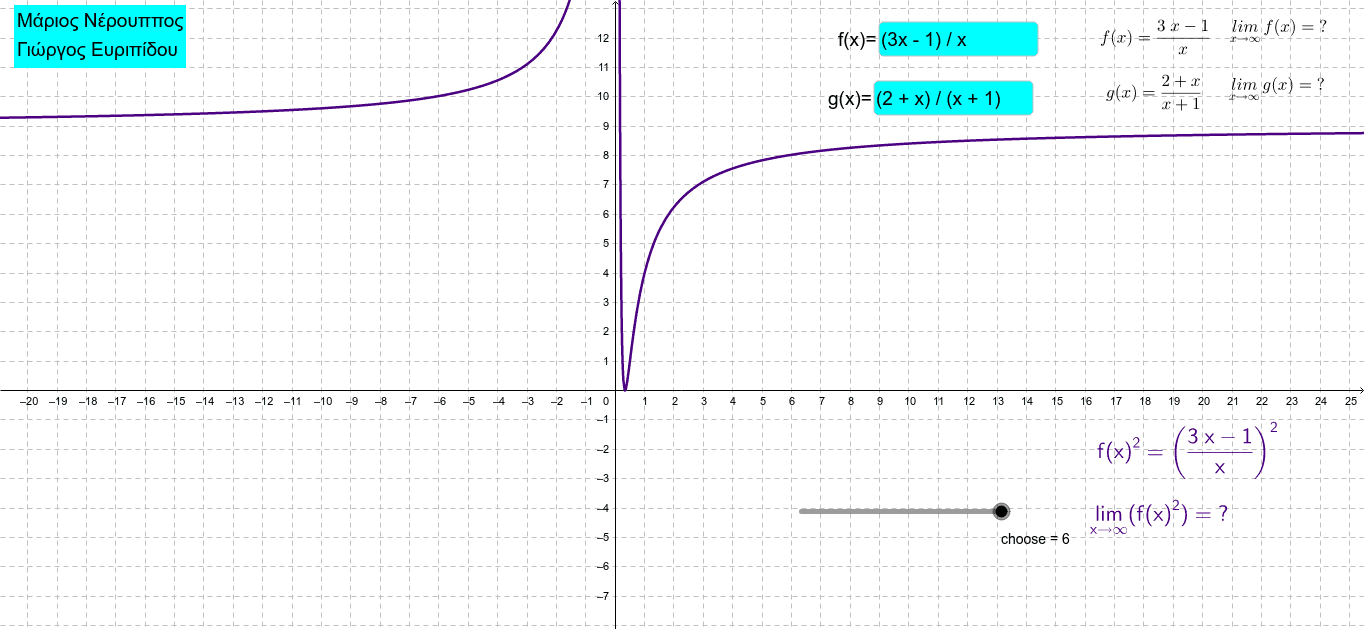
This example demonstrates how to draw limit function graphs using GeoGebra, highlighting concepts like limits, logic, cube, rotation, and piecewise functions. The construction uses commands such as Asymptote, Limit, Textfield, and objects like f, Asymptotes_f, g, Asymptotes_g. Suitable for high school students or college undergraduates learning limit functions and geometric constructions.
GeoGebra Commands & Parameters
Asymptote(f) → Asymptotes_fAsymptote(g) → Asymptotes_gLaTeX(f, true, true) → text1Limit(f, Infinity) → lim_fLimit(g, Infinity) → lim_gLimit(f(x) + g(x), Infinity) → lim_{f+g}Asymptote(f(x) + g(x)) → Asymptote_{f+g}Asymptote(p) → Asymptotes_{2f}Limit(p, Infinity) → lim_{2f}Asymptote(q) → Asymptote_{f-g}Limit(q, Infinity) → lim_{f-g}Asymptote(r) → Asymptote_{f.g}Limit(r, Infinity) → lim_{f.g}Asymptote(s) → Asymptote_{f/g}Limit(s, Infinity) → lim_{f/g}Asymptote(t) → Asymptote_{f^2}Limit(t, Infinity) → lim_{f^2}Textfield(f) → inputBox1Textfield(g) → inputBox2
AI Drawing Prompt Reference
Create a geometric construction illustrating limit functions, showing concepts like limits, asymptotes, and piecewise functions. Start by plotting two functions and marking their asymptotes, then calculate and display their limits at infinity. Next, perform addition, subtraction, multiplication, division, and squaring on these functions, plot the resulting graphs, and show their asymptotes and limits. Finally, add text boxes to input the expressions of the original functions.
The prompt above was compiled from the original drawing commands and is for reference only.