
GeoGebra Lesson: Domain and Range of Functions (Part 2)
Loading the math board and drawing, please wait…
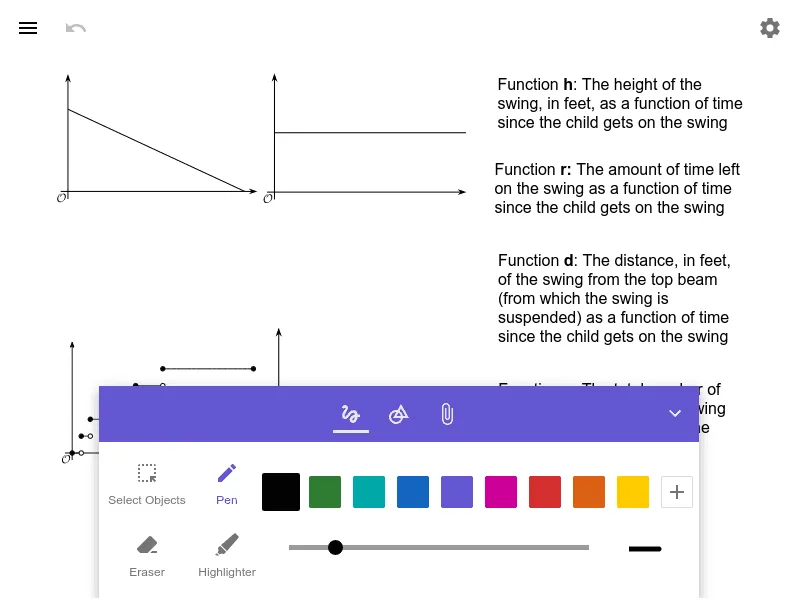
This GeoGebra example demonstrates how to determine and interpret a function’s domain and range using visual/graph-based reasoning. It focuses on identifying which inputs are allowed (domain) and which outputs are actually produced (range), linking algebraic function definitions to what can be read from the graph or constrained geometry. Key concepts include functions, domain, range, and how graph visibility and coordinate constraints correspond to mathematical intervals. With no provided construction commands, the construction is best understood as creating a function or related geometric setup in GeoGebra’s coordinate plane, then using the plotted/valid portion of the graph (or region) to read off the horizontal and vertical extents. Suitable for secondary school through pre-college learners, especially for lessons on function graphs, reading intervals, and range/domain reasoning.
AI Drawing Prompt Reference
Draw a coordinate plane with a function graph that clearly shows its domain and range. The graph should be a visible curve or polyline whose horizontal extent (domain) and vertical extent (range) are evident from the plotted portion. Include axes, grid lines, and optional dashed lines or shaded regions to mark the intervals for allowed inputs and outputs. Start by sketching the function curve, then determine the horizontal and vertical boundaries based on the visible part of the graph, and highlight these intervals with guides or shading. The overall style should be clean and educational, suitable for a lesson on reading domain and range from a graph.
The prompt above was compiled from the original drawing commands and is for reference only.