
GeoGebra Lesson: Data Representations
Loading the math board and drawing, please wait…
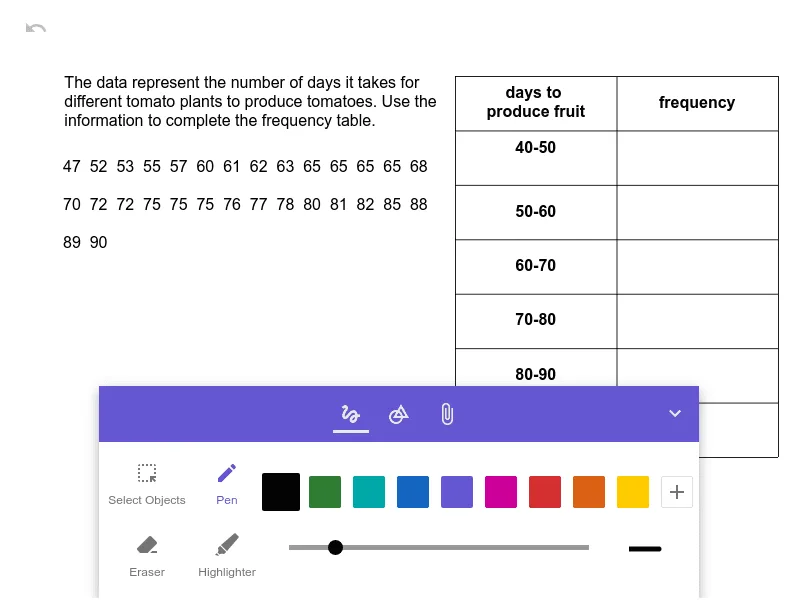
This example dynamically demonstrates various data representations using GeoGebra, including linear regression, vectors, cosine functions, planes, and exponential functions. Core math concepts involve linear regression analysis, vector operations, trigonometric applications, spatial geometry, and exponential growth models. Construction highlights include using GeoGebra commands/objects a, b, c for parametric visualization. Suitable for high school mathematics education to enhance understanding of multivariate data analysis and spatial geometry.
GeoGebra Commands & Parameters
Table aInlinetext bInlinetext c
AI Drawing Prompt Reference
Create a dynamic teaching graphic for data representations: start by showing a table of example data, then add two embedded inline text annotations on the canvas to mark key points and provide guidance. The visual should be suitable for illustrating relationships among multiple ways of representing data, including linear regression, vector-based ideas, and function-related elements such as cosine and exponential growth. Arrange it in a clear sequence: data table first, then the two text labels, keeping the layout readable and instructive.
The prompt above was compiled from the original drawing commands and is for reference only.