
GeoGebra Graphing Equations and Inequalities Tutorial
Loading the math board and drawing, please wait…
In collections
Area-Volumen-Algebra-inequalities-Trigonometric
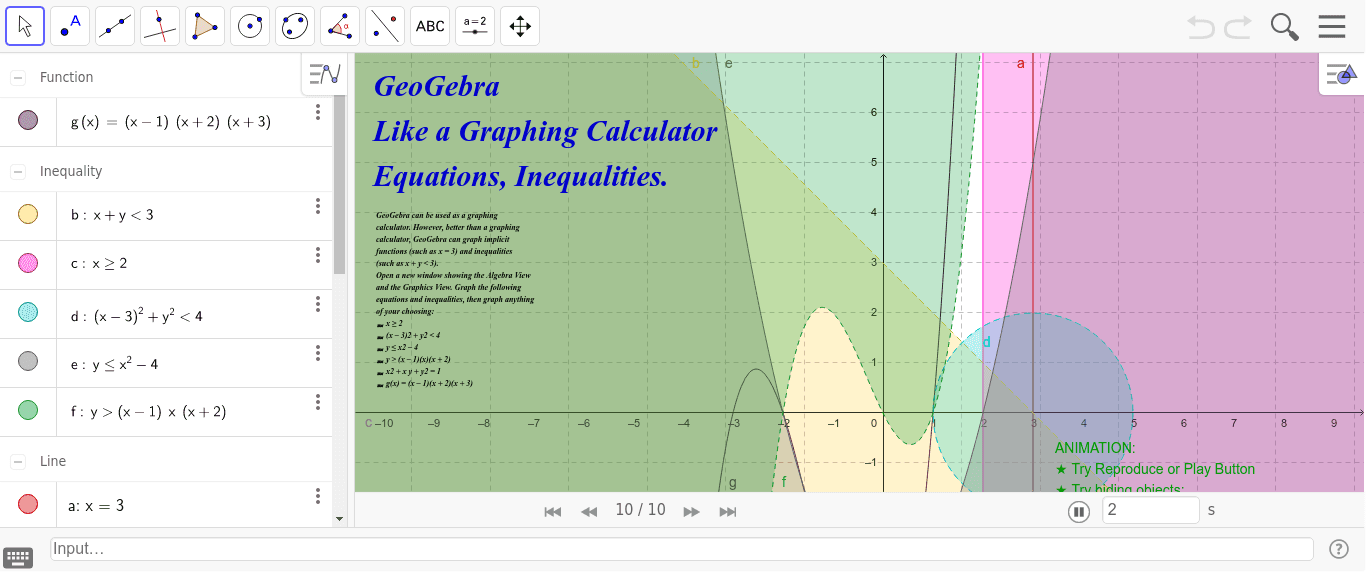
This example demonstrates how to graph equations and inequalities in GeoGebra, involving core math concepts like equations, inequalities, roots, kites, scalene triangles, Poisson distribution, and matrices. Key GeoGebra commands used include objects like texto1, texto2, a, b, c, d, e, f, g, texto3. Suitable for high school students and educators.
GeoGebra Commands & Parameters
Line a(1.0, 0.0, -3.0)b(x, y) = x + y < 3c: x ≥ 2d(x, y) = (x - 3)^(2) + y^(2) < 4e(x, y) = y ≤ x^(2) - 4f(x, y) = y > (x - 1) * x * (x + 2)g(x) = (x - 1) * (x + 2) * (x + 3)
AI Drawing Prompt Reference
Create a graph showing multiple inequality regions and function plots, including a line, a circle, a parabola, and a cubic function, with different colors for inequality solutions such as x+y<3, x≥2, (x-3)²+y²<4, y≤x²-4, y>(x-1)x(x+2), and y>(x-1)(x+2)(x+3), and a slider for dynamic changes.
The prompt above was compiled from the original drawing commands and is for reference only.