
Geogebra Example: Writing Quadratic Equations from X-Intercepts and a Point
Loading the math board and drawing, please wait…
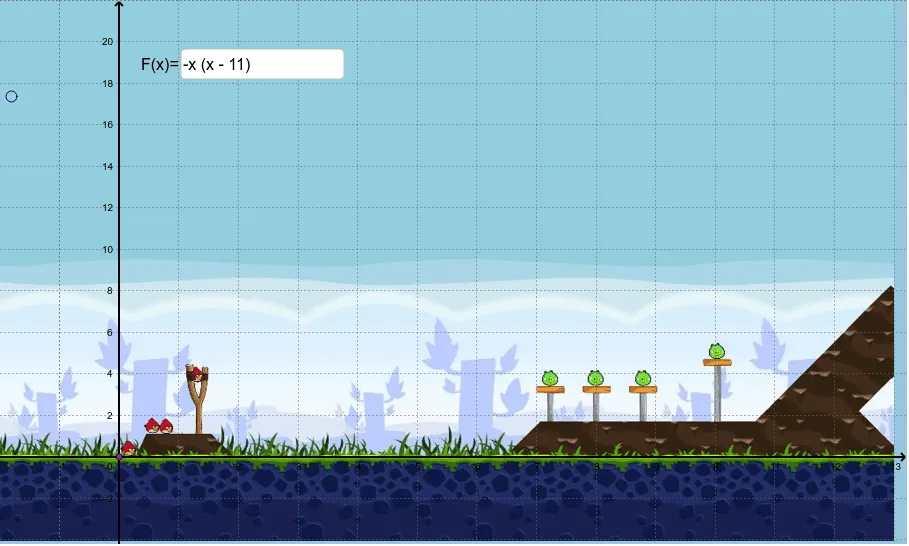
This example demonstrates how to graph quadratic functions using x-intercepts and a point, and then derive the equation. It involves core math concepts like quadratic functions, x-intercepts, vertex coordinates, and analytical geometry. Construction highlights include using commands like Intersect and Textfield, along with objects such as W_1, F, P, a, A, W_2, W_4, pic2, and inputBox1. Suitable for high school students learning about quadratic functions and their properties, ideal for classroom demonstrations and problem-solving.
GeoGebra Commands & Parameters
Intersect(F, a) → ATextfield(F) → inputBox1
AI Drawing Prompt Reference
Graph a quadratic function by plotting its x-intercepts and a given point, then display the function's equation in a text box. First, identify the x-intercepts and vertex of the function, then construct the graph using these points. Finally, add a text box next to the graph to input and show the quadratic equation.
The prompt above was compiled from the original drawing commands and is for reference only.