
GeoGebra Dynamic Visualization of Geological Strike and Dip
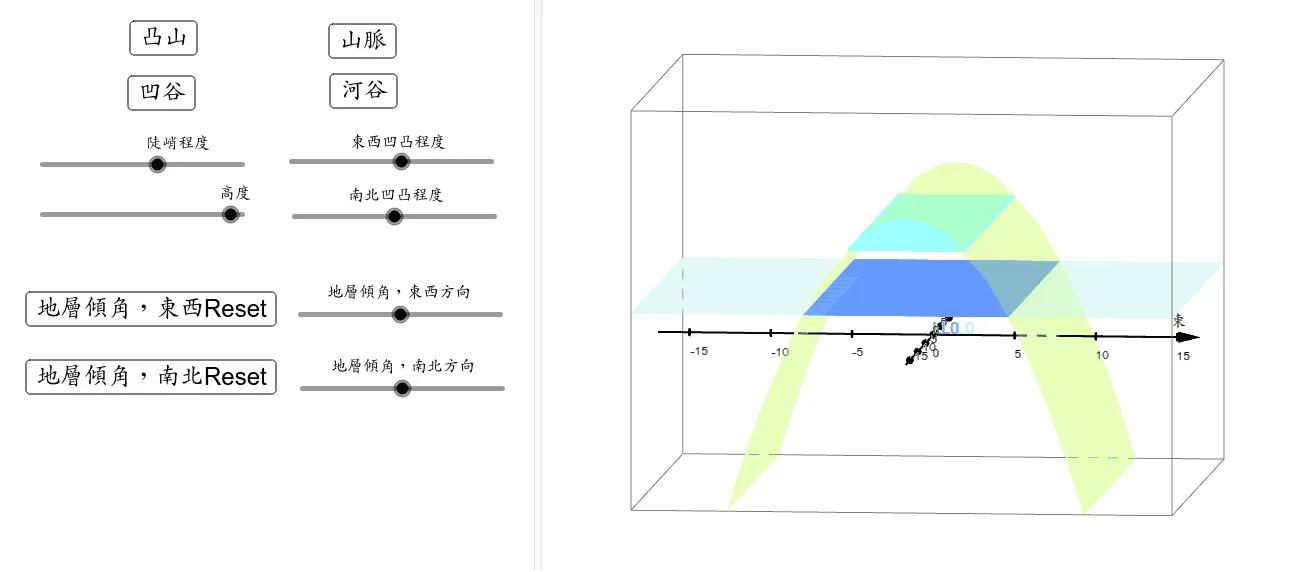
This example demonstrates the spatial geometric relationship and visual representation of geological strike and dip. It involves core mathematical concepts such as tangent functions, trigonometry, and derivatives to calculate slope angles and rates of change. Construction highlights include the use of objects like C, D, 东西, 南北, L0-LL3, h, g, a, and interactive button controls (button1-6). Suitable for high school or university interdisciplinary teaching of geology and mathematics, used for dynamically displaying geological cross-sections and function graphs.
Loading the math board and drawing, please wait…