
Geogebra Bar Chart and Polygon Construction
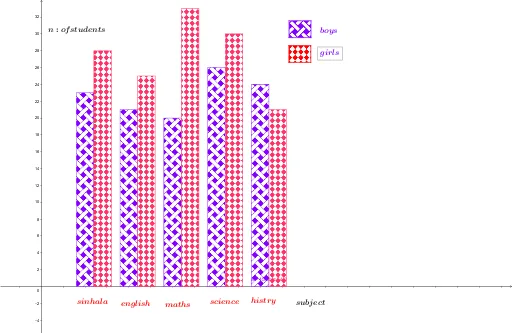
Loading the math board and drawing, please wait…
This example demonstrates how to construct bar charts and polygons using GeoGebra, showcasing their relationship with linear functions and set theory. Core math concepts include bar charts, polygon construction, linear functions, set theory, and solid geometry. Key GeoGebra commands and objects used are BarChart, Polygon, along with points (A1-A17, B1-B5, C1-C5) and lines/texts (l1-l4, a-b). Suitable for high school mathematics teaching, illustrating data visualization, geometric construction, and function graphs.
GeoGebra Commands & Parameters
BarChart(l1, l2, 0.4) → aBarChart(l3, l4, 0.4) → bPolygon(A, B, C, D) → q1, a_1, b_1, c, dPolygon(E, F, G, H) → q2, e, f, g, h