
Geoboard Area 3C: Parallelogram and Optimization
Loading the math board and drawing, please wait…
In collections
Geoboard Area
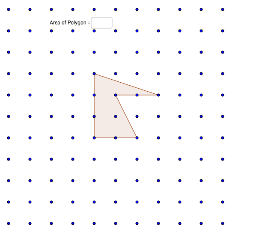
①This GeoGebra example demonstrates how to construct a parallelogram on a geoboard and compute its area, while integrating concepts of area, angles, upper and lower sums (Riemann sums), and optimization problems to explore how area changes with vertex positions. ②Core mathematical concepts include polygon area calculation, properties of parallelograms, angle relationships, upper and lower sums (Riemann sums), and optimization; students can dynamically adjust vertices on the geoboard to observe area variations. ③Construction highlights: from the summary, the Polygon command creates poly1, Textfield inputs values, and Area computes area; numerous point objects (A, B, C, E, F, etc.) and auxiliary objects (R, Q, H, etc.) are used, likely with sliders or text fields to control coordinates for dynamic exploration. ④Suitable for middle and high school mathematics (grades 8-12) in geometry and introductory calculus, useful for teaching area formulas, parallelogram identification, and optimization intuition, as well as for math labs or inquiry-based learning.
GeoGebra Commands & Parameters
Polygon(C_3, R, I_2, E_3, I_3) → poly1, c_3, r_1, i_2, e_3, i_1Textfield() → InputBox1Area(poly1) → polyArea
AI Drawing Prompt Reference
Draw a parallelogram on a geoboard and calculate its area, demonstrating how area changes with vertex positions. Integrate concepts of upper and lower sums (Riemann sums) and optimization. Use multiple points and auxiliary objects, controlled by sliders or text fields for dynamic exploration of area variations.
The prompt above was compiled from the original drawing commands and is for reference only.