
Gamma Probability Distribution
Loading the math board and drawing, please wait…
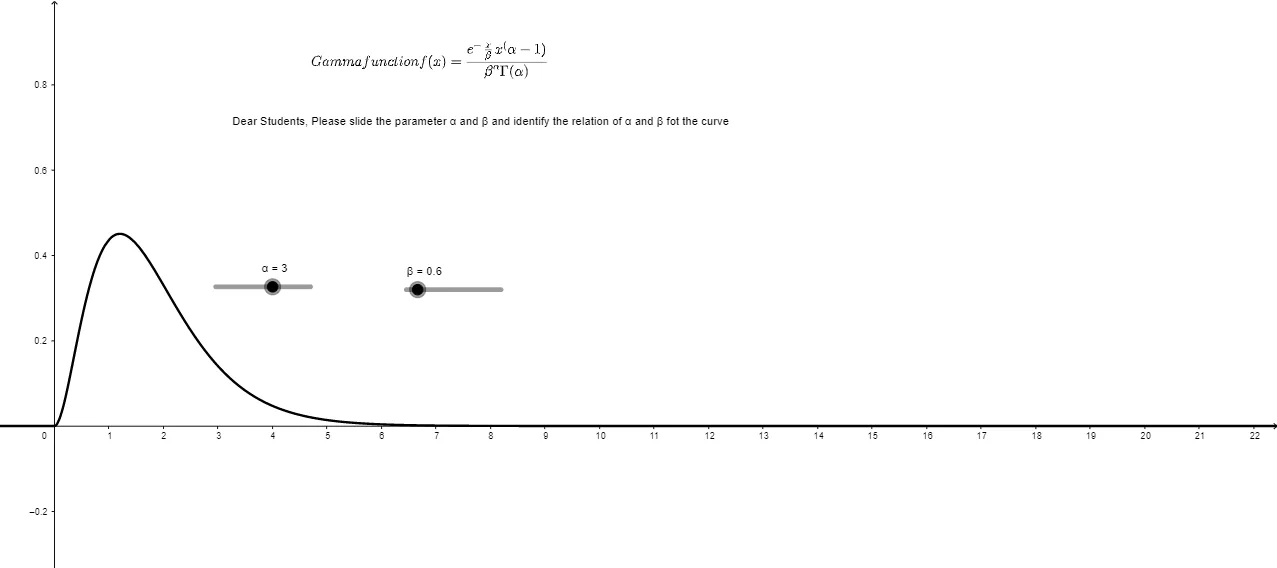
This example demonstrates the graph of the gamma probability distribution, a continuous probability distribution often used to model continuous random variables. By adjusting parameters α and β, the shape of the distribution can be observed. The example uses GeoGebra commands for objects α, β, Γ, f, text1, text2 to construct the graph. Suitable for high school and above students learning probability and statistics.
GeoGebra Commands & Parameters
Numeric α(3)Numeric β(0.6)gamma(α)f(x) = If[x < 0, 0, (x^(α - 1) * ℯ^(((-x)) / β) / ((β^(α) * Γ)))]
AI Drawing Prompt Reference
Draw the gamma probability distribution with parameters α set to 3 and β set to 0.6. First, plot the values of α and β, then draw the gamma function, and finally use the function f(x) = (x^(α-1) * e^((-x)/β) / (β^α * Γ)) for x > 0 to represent the distribution.
The prompt above was compiled from the original drawing commands and is for reference only.