
Function Square Root Curve Representation
Loading the math board and drawing, please wait…
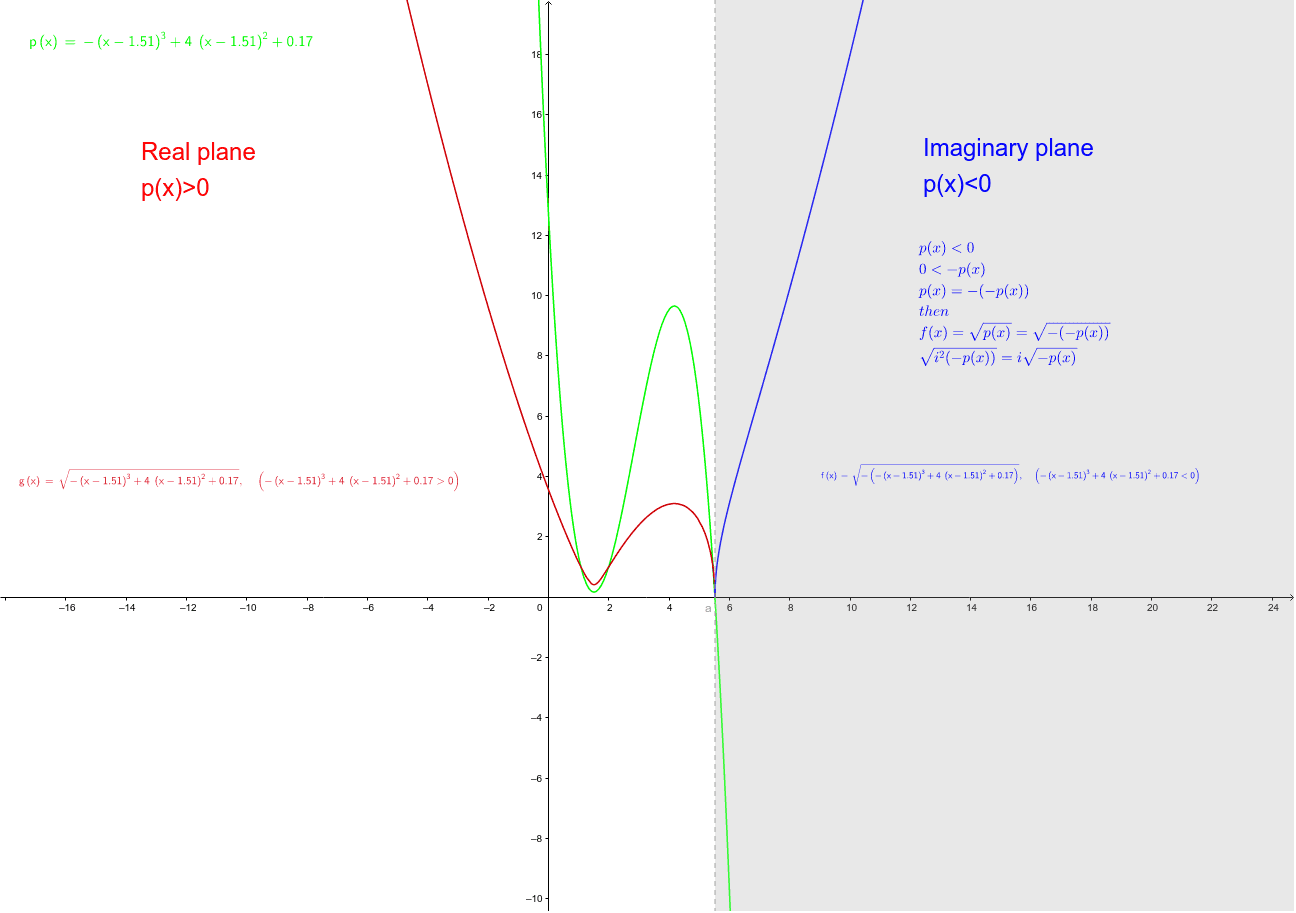
This example demonstrates how to plot the curve of the square root of a function p(x), represented as g(x) = sqrt(p(x)). Key math concepts include functions, square root operations, and analytical geometry graphing. GeoGebra commands used are LaTeX for text objects (texte2, texte3), variable definitions p and g, function f(x), parameter a, and auxiliary text objects (texte4, texte1, texte5, texte6). Suitable for high school mathematics education to understand function transformations and graphing techniques.
GeoGebra Commands & Parameters
LaTeX(p, true, true) → texte1LaTeX(g, true, true) → texte5LaTeX(f, true, true) → texte6
AI Drawing Prompt Reference
Plot the square root curve g(x) = sqrt(p(x)) of function p(x). First, define function f(x) and draw its graph. Then, define parameter a and draw the graph of g(x) based on p(x). Finally, add text to explain function transformations and graphing techniques.
The prompt above was compiled from the original drawing commands and is for reference only.