
Function Rotation
Loading the math board and drawing, please wait…
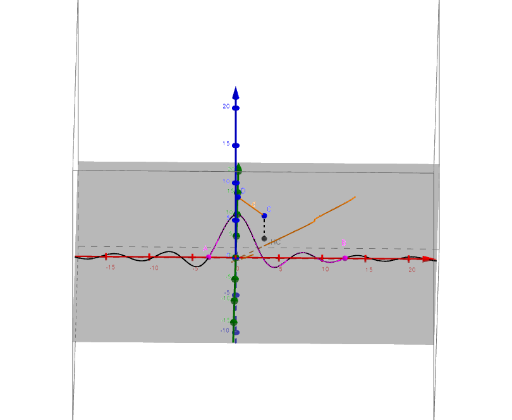
This example demonstrates the rotation of a function graph around the three coordinate axes or an axis defined by points C and D. It involves core mathematical concepts such as functions, rotation, algebra, piecewise functions, arithmetic mean, combinatorics, and rational numbers. The construction uses GeoGebra commands/objects like Point, CurveCartesian, Rotate, Segment, and Textfield. Suitable for high school and above mathematics learners to understand spatial transformations of function graphs.
GeoGebra Commands & Parameters
Point(f) → APoint(f) → BCurveCartesian(t, f(t), 0, t, x(A), x(B)) → aRotate(a, α, Line[C, xAxis]) → axRotate(a, α, Line[C, yAxis]) → ayRotate(a, α, Line[C, zAxis]) → azSegment(C, D) → dRotate(a, α, Line[C, D]) → adTextfield(f) → ChampTexte1Segment(C, HC) → h
AI Drawing Prompt Reference
Draw a rotated function graph. The graph rotates around the x-axis, y-axis, and z-axis. The graph consists of a curve and points. The curve is based on the function f(t). After rotation, the graph appears in different positions. Ensure the graph is clear to show the changes.
The prompt above was compiled from the original drawing commands and is for reference only.