
Function Loop Animation
Loading the math board and drawing, please wait…
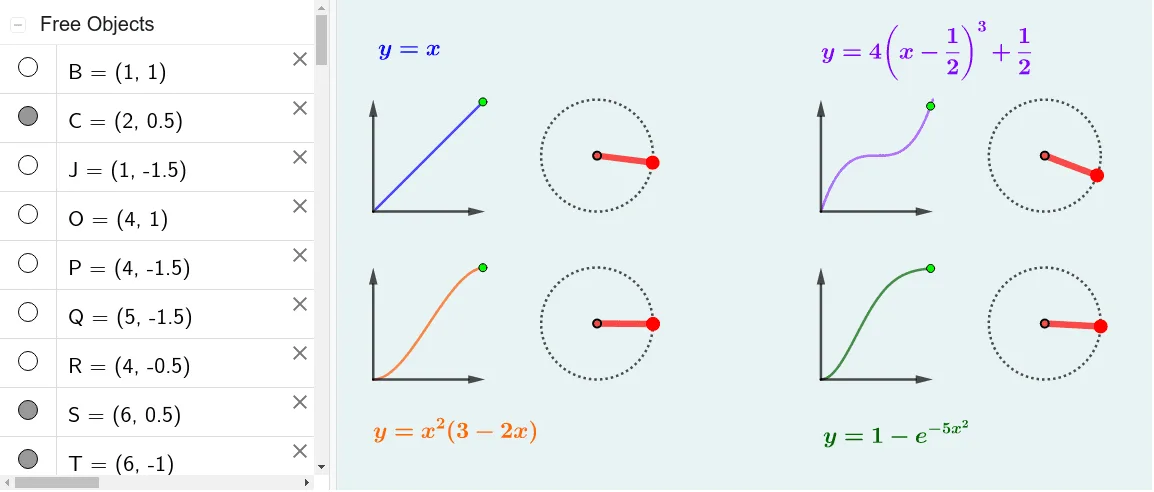
This example demonstrates the animation of a function loop through dynamic visualization. It involves core math concepts like function graphs, coordinate geometry, vectors, polygons, and orthocenter. Key GeoGebra commands used include Intersect, Root, Rotate, Point, Vector, Segment, and Circle. Suitable for high school and above students to understand function animations and geometric transformations.
GeoGebra Commands & Parameters
Intersect(xAxis, yAxis) → ARoot(q, 0.62) → GRotate(C + (0.5, 0), (F1(a) * 360°), C) → DPoint(yAxis) → EVector(A, E) → uPoint(xAxis) → FVector(A, F) → vPoint(yAxis) → HPoint(yAxis) → IVector(H, I) → wVector(H, J) → bRotate(K + (0.5, 0), (F2(a) * 360°), K) → LPoint(xAxis) → MPoint(xAxis) → NVector(M, N) → cVector(M, O) → dVector(P, Q) → eVector(P, R) → iRotate(S + (0.5, 0), (F3(a) * 360°), S) → URotate(T + (0.5, 0), (F4(a) * 360°), T) → VSegment(C, D) → jSegment(K, L) → kSegment(S, U) → lSegment(T, V) → mCircle(C, D) → c_1Circle(S, U) → d_1Circle(T, V) → e_1Circle(K, L) → k_1
AI Drawing Prompt Reference
Create an animated diagram showing function-driven rotations: start with the origin at the axis intersection. Place several points on the x-axis and y-axis, and draw vectors from the origin to these points. Also draw vectors between pairs of points on each axis to represent changes. Then choose four distinct centers, each with a nearby point offset horizontally; rotate each offset point around its center by an angle determined by a separate function value. Connect each center to its rotated point with a segment, and draw a circle centered at each center with radius equal to that segment. The animation shows how changing function values alter the rotations and circular paths.
The prompt above was compiled from the original drawing commands and is for reference only.