
Function Graphs and Geometric Constructions Example
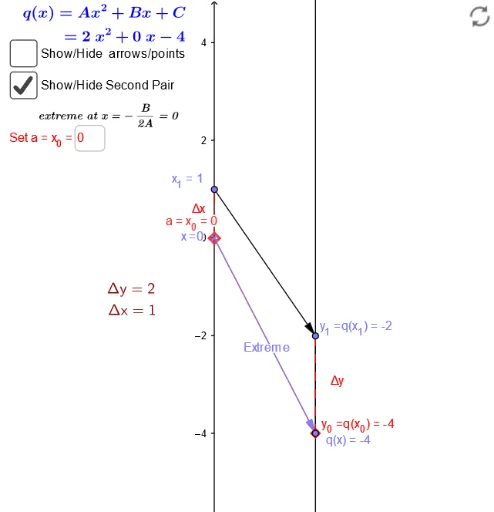
Loading the math board and drawing, please wait…
This example demonstrates the plotting of linear functions, piecewise functions, and sine functions, along with the application of tree diagrams. Core math concepts include function graphs, linear functions, piecewise functions, trigonometry, vectors, geometric constructions. It utilizes GeoGebra commands/objects like Vector, Textfield, Segment, Sequence. Suitable for high school mathematics teaching, covering function graphing, geometric transformations, and introductory probability & statistics.
GeoGebra Commands & Parameters
Vector(A_1, B_1) → uTextfield(f) → inputBox1Vector(x_1, y_1) → vSegment(q_x, F) → cSegment(E, F) → dSegment(A_1, x_1) → eSegment(B_1, y_1) → gSegment(B_1, y_1) → h_1Sequence(Vector[(0, i), (2, f(i))], i, -3, 3, 1) → list1Sequence((i, f(i)), i, -3, 3, 1) → list2Vector(G, H) → ExtremeTextfield(C) → InputBox1Textfield(A) → InputBox2Textfield(B) → InputBox3Textfield(xx_0) → InputBox4
AI Drawing Prompt Reference
Draw a graph including linear, piecewise, and sine functions, with vectors and tree diagrams. Start by plotting several vectors, then graph the functions based on the expressions in the input boxes, including piecewise and sine functions. Connect key points with line segments to show geometric constructions, and use sequences to generate points for the function graphs. Include text boxes for inputting function expressions and parameter values.
The prompt above was compiled from the original drawing commands and is for reference only.