
Function Graphing and Polynomial Fitting Example
Loading the math board and drawing, please wait…
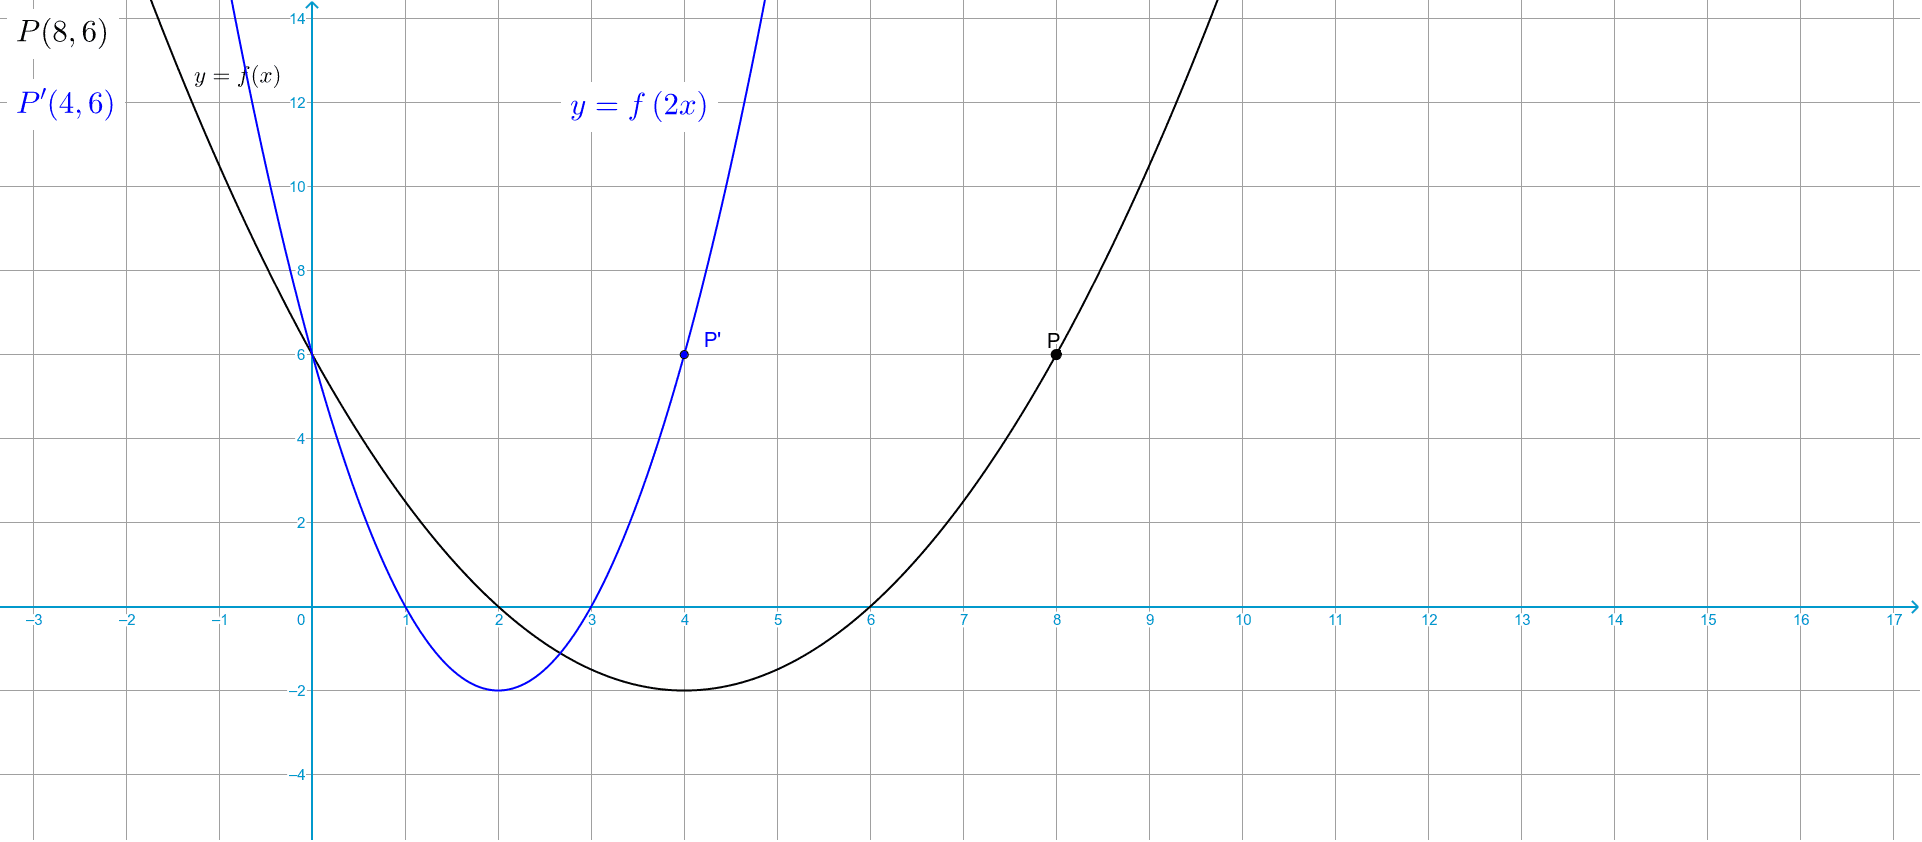
This example demonstrates how to graph functions and perform polynomial fitting using GeoGebra. Core math concepts include function graphs, quadratic functions, complex numbers, power functions, probability, natural numbers, random experiments, and coordinate geometry. Key GeoGebra commands and objects used are Element, SelectedIndex, SelectedElement, First, FitPoly, Point, Translate, Vector, If, Segment, listStretchValue, listStretchText, k, listTransform, t, listNum, n, E, D, C, B, A, listPoint, f, P, listTranslateValue, listTranslateText, h, P', u, showPoints, f_{34}, P'', footP, P''' etc. Suitable for high school mathematics teaching, demonstrating function graphing, polynomial fitting, and complex number applications.
GeoGebra Commands & Parameters
Element(listStretchValue, SelectedIndex[listStretchText]) → kSelectedIndex(listTransform) → tSelectedElement(listNum) → nFirst({A, B, C, D, E}, n) → listPointFitPoly(listPoint, n - 1) → fPoint(f) → PElement(listTranslateValue, SelectedIndex[listTranslateText]) → hTranslate(P, Vector[If[t ≟ 1, (0, h), If[t ≟ 2, (h, 0)]]]) → P'Vector(P, P') → uIf(t ≟ 3, (-f(x)), If[t ≟ 4, f((-x))]) → f_{34}If(t ≟ 3, Mirror[P, y + (0 * z) = 0], If[t ≟ 4, Mirror[P, x + (0 * z) = 0]]) → P''Segment(P, Midpoint[P, P'']) → footPIf(t ≟ 5, (x(P), (k * y(P))), If[t ≟ 6, ((k * x(P)), y(P))]) → P'''Segment(P'', Midpoint[P, P'']) → footP''If(t ≟ 5, (x(P), 0), If[t ≟ 6, (0, y(P))]) → QTranslate(f, Vector[If[t ≟ 1, (0, h), If[t ≟ 2, (h, 0)]]]) → f_{12}If(t ≟ 5, (k * f(x)), If[t ≟ 6, f(x / k)]) → f_{56}If(¬showFunction, textGuess, If[t ≟ 1, text1, If[t ≟ 2, text2, If[t ≟ 3, text3, If[t ≟ 4, text4, If[t ≟ 5, text5, If[t ≟ 6, text6, ""]]]]]]) → textFunctionIf(t ≟ 1, textT1, If[t ≟ 2, textT2, If[t ≟ 5, textT5, If[t ≟ 6, textT6]]]) → textTransform