
Function Graph Transformation Demo
Loading the math board and drawing, please wait…
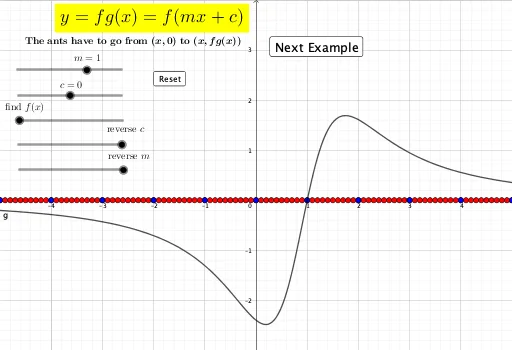
This example demonstrates the transformation rules of the function f(mx+c) by dynamically adjusting parameters m and c to observe the effects on the graph. Key math concepts include function graph transformations, linear transformations, and parameter influence. Construction highlights involve using GeoGebra's Sequence command to generate function sequences, with interactive elements like button1, v, n, u, d, and objects such as X, Q, g for graph plotting. Suitable for high school mathematics teaching to understand basic transformation properties of function graphs.
GeoGebra Commands & Parameters
Sequence(-6 + (0.1 * i), i, 0, 110) → XSequence(i, i, -6, 5) → Z
AI Drawing Prompt Reference
Create a demonstration of function graph transformations, showing how the graph of f(mx+c) changes as parameters m and c are adjusted. Include a smooth base curve representing the original function, and a sequence of curves generated by varying m and c, illustrating shifts, stretches, and compressions. The x-axis ranges from -6 to 5, and the y-axis covers -6 to 5, with clear tick marks. Add interactive sliders or buttons to adjust m and c, updating the curves in real time. The layout is clean, suitable for high school teaching, emphasizing visual comparison of transformations.
The prompt above was compiled from the original drawing commands and is for reference only.