
Function Graph and Locus
Loading the math board and drawing, please wait…
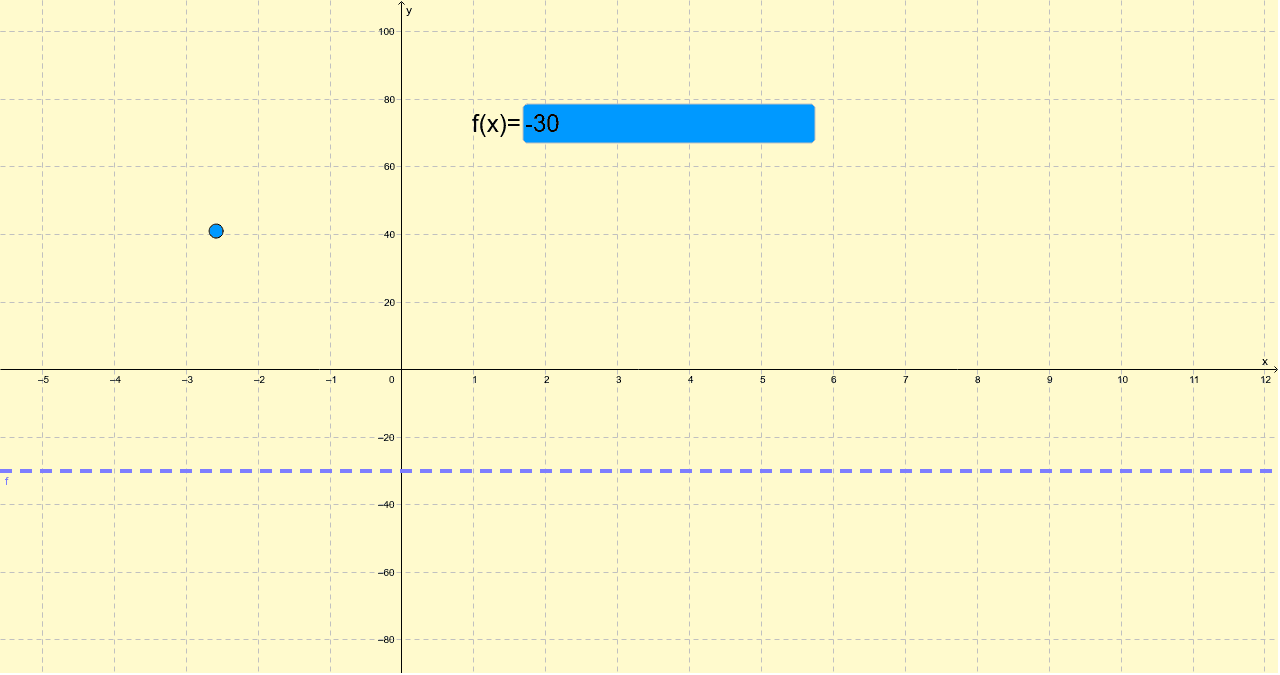
This example demonstrates how students can edit a function expression to match the locus of a constrained point. Key mathematical concepts include function graphs and loci. It uses GeoGebra commands such as Point and Textfield. Suitable for high school math education, helping students understand the relationship between function graphs and loci.
GeoGebra Commands & Parameters
Point(c) → ATextfield(f) → inputBox1
AI Drawing Prompt Reference
Draw a function graph and show a point moving along the graph's locus, controlled by an input box for the function expression to illustrate the relationship between function graphs and loci, suitable for high school math education.
The prompt above was compiled from the original drawing commands and is for reference only.