
Edit Function Expression to Match Locus of a Constrained Point
Loading the math board and drawing, please wait…
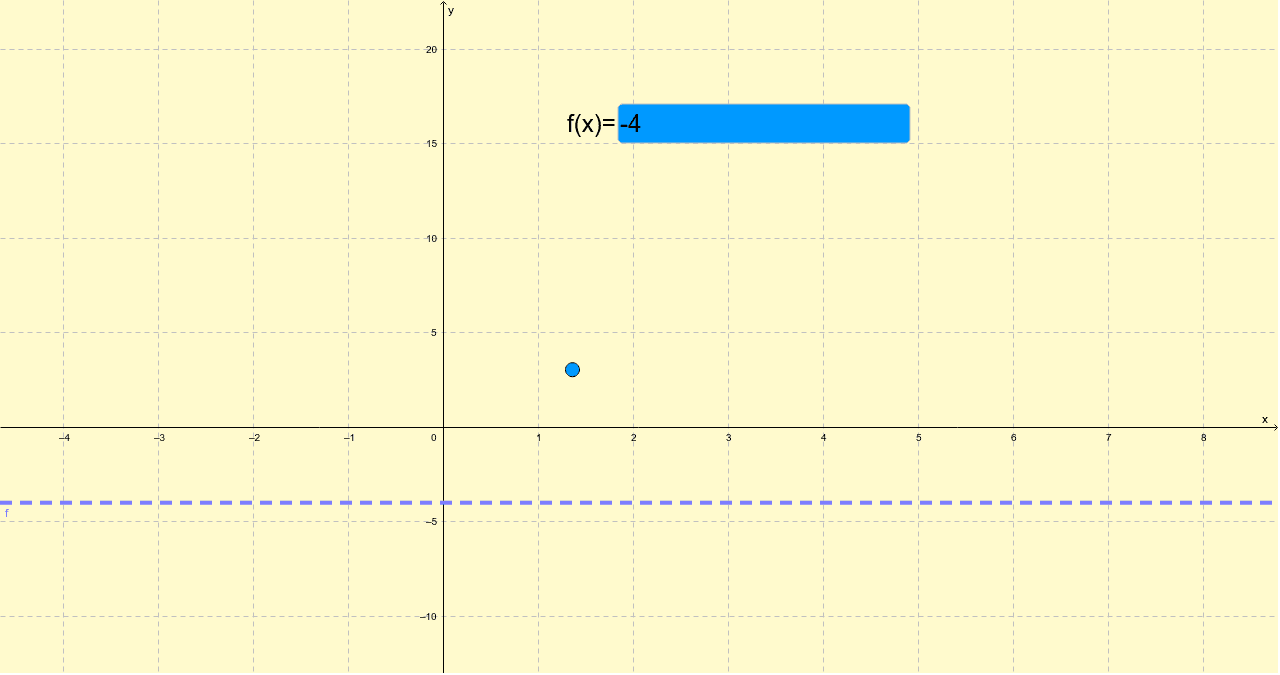
This interactive GeoGebra example presents a task where students must edit the algebraic expression of a function so that its graph matches the locus of a constrained point. The core mathematical concepts involve function graphs, loci, constraints, and the correspondence between algebraic forms and geometric representations. The construction uses GeoGebra commands: Point to create the constrained point A, Textfield to provide an input box (inputBox1), and objects including function c, point A, function f, and the input box. Students modify the expression in the input box to adjust function f until its curve aligns with the locus traced by point A. This activity is suitable for high school or early college students, reinforcing understanding of function transformations, algebraic manipulation, and geometric visualization.
GeoGebra Commands & Parameters
Point(c) → ATextfield(f) → inputBox1
AI Drawing Prompt Reference
Draw a function graph and adjust its equation in the input box so that its curve matches the path traced by point A. First, create point A, then input function f in the text field, and modify f's equation to align its curve with point A's path.
The prompt above was compiled from the original drawing commands and is for reference only.