
Function and Its Derivatives Demonstration
Loading the math board and drawing, please wait…
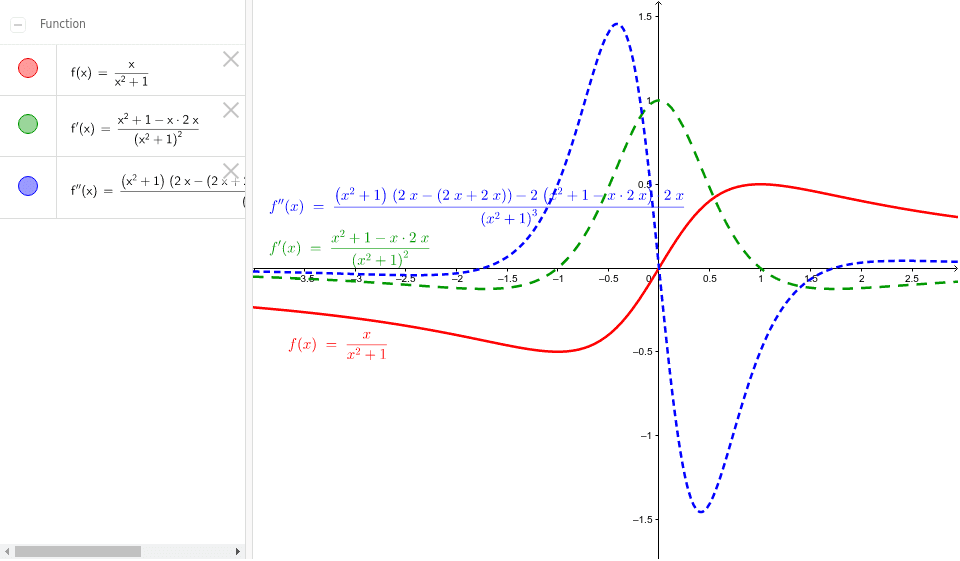
This example demonstrates the relationship between the function f and its first derivative f' and second derivative f'', illustrating concepts like increasing/decreasing behavior, concavity, and inflection points in calculus. Core math concepts include functions, derivatives, second derivatives, curve sketching, limits, and function property analysis. It uses GeoGebra commands/objects f, f', f'' for plotting. Suitable for high school and above students learning calculus, function analysis, and curve drawing.
GeoGebra Commands & Parameters
f(x) = x / (x^(2) + 1)f'(x) = f'(x)f''(x) = f''(x)
AI Drawing Prompt Reference
Plot the graph of a function and its first and second derivatives to demonstrate the function's increasing/decreasing behavior, concavity, and inflection points. Use blue solid line for the function, red dashed line for the first derivative, and green dotted line for the second derivative, all in the same coordinate system with labeled axes to show the relationship between the function and its derivatives.
The prompt above was compiled from the original drawing commands and is for reference only.