
Fractions, Decimals, and Percents
Loading the math board and drawing, please wait…
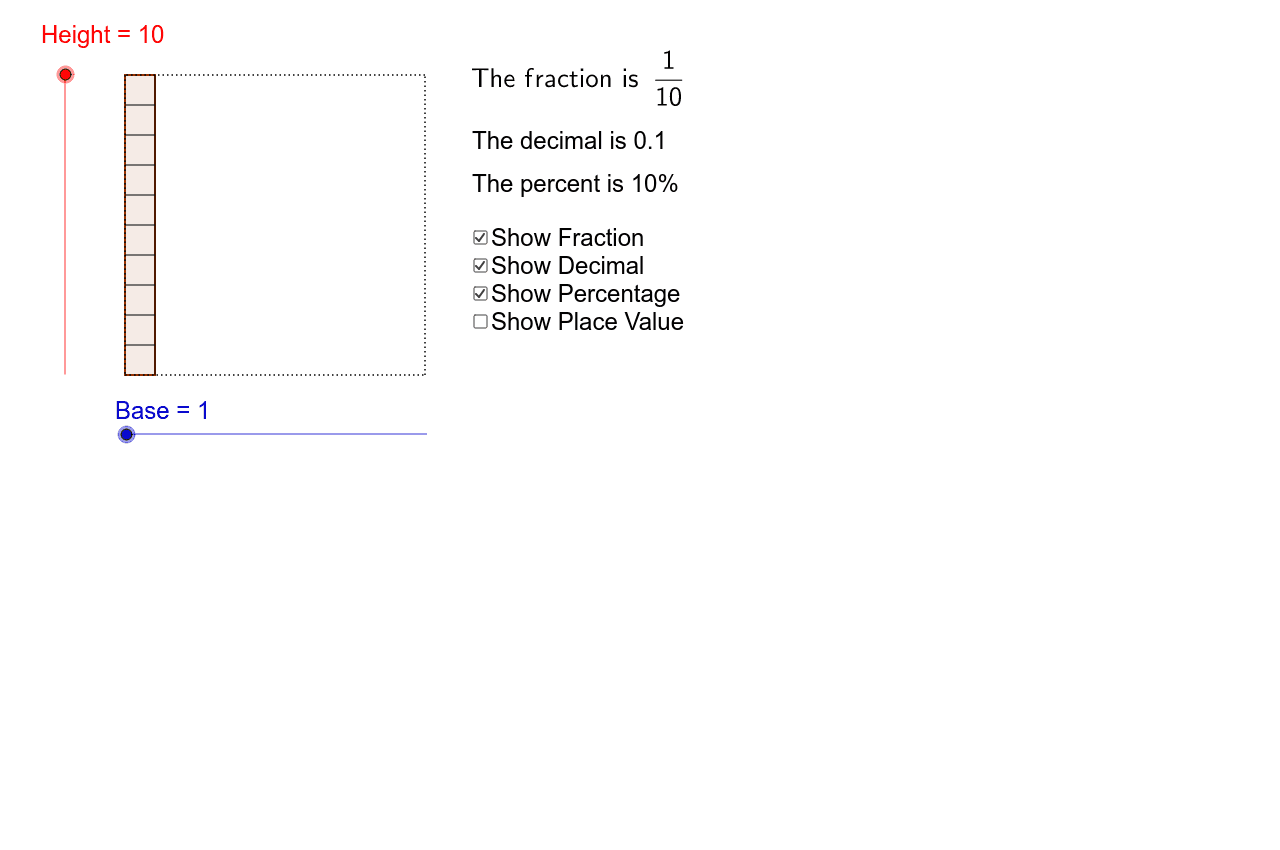
This example demonstrates the conversion relationships and visual representation among fractions, decimals, and percentages. Core math concepts include fraction operations, decimal representation, percentage calculations, and geometric area/proportion. GeoGebra commands and objects used in construction are Point, Segment, OrthogonalLine, Rotate, Intersect, Polygon, Line, and GCD. Suitable for middle school and above learners to understand numerical conversions and geometric applications.
GeoGebra Commands & Parameters
Point(Circle[A, Base]) → BSegment(A, B) → aOrthogonalLine(A, a) → cPoint(Circle[A, Height]) → CSegment(A, C) → eRotate(A, 90°, A) → A'Rotate(C, 90°, A) → C'Segment(A', C') → fOrthogonalLine(B, a) → gOrthogonalLine(C', c) → hIntersect(g, h) → DSegment(C', D) → iSegment(D, B) → jPolygon(C', A, B, D) → P, c', a_1, b_1, d_1Line(E, F) → kIntersect(d_1, k) → GIntersect(a_1, k) → HSegment(G, H) → lLine(I, J) → mLine(K, L) → nLine(M, N) → pLine(O, Q) → qLine(R, S) → rLine(T, U) → sLine(V, W) → tLine(Y, Z) → c_1Line(A_1, B_1) → e_1Line(C_1, D_1) → f_1Line(E_1, F_1) → g_1Line(G_1, H_1) → h_1Line(I_1, J_1) → i_1Line(K_1, L_1) → j_1Line(M_1, N_1) → k_1Line(O_1, P_1) → l_1Line(Q_1, R_1) → m_1Intersect(d_1, m) → S_1Intersect(a_1, m) → T_1Intersect(d_1, n) → U_1Intersect(a_1, n) → V_1Intersect(d_1, p) → W_1Intersect(a_1, p) → Y_1Intersect(d_1, q) → Z_1Intersect(a_1, q) → A_2Intersect(d_1, r) → B_2Intersect(a_1, r) → C_2Intersect(d_1, s) → D_2Intersect(a_1, s) → E_2Intersect(d_1, t) → F_2Intersect(a_1, t) → G_2Intersect(d_1, c_1) → H_2Intersect(a_1, c_1) → I_2Segment(S_1, T_1) → n_1Segment(U_1, V_1) → p_1Segment(W_1, Y_1) → q_1Segment(Z_1, A_2) → r_1Segment(B_2, C_2) → s_1Segment(D_2, E_2) → t_1Segment(F_2, G_2) → a_2Segment(H_2, I_2) → b_2Intersect(c', e_1) → J_2Intersect(b_1, e_1) → K_2Intersect(c', f_1) → L_2Intersect(b_1, f_1) → M_2Intersect(c', g_1) → N_2Intersect(c', h_1) → O_2Intersect(c', i_1) → P_2Intersect(c', j_1) → Q_2Intersect(c', k_1) → R_2Intersect(c', l_1) → S_2Intersect(c', m_1) → T_2Intersect(b_1, g_1) → U_2Intersect(b_1, h_1) → V_2Intersect(b_1, i_1) → W_2Intersect(b_1, j_1) → Y_2Intersect(b_1, k_1) → Z_2Intersect(b_1, l_1) → A_3Intersect(b_1, m_1) → B_3Segment(J_2, K_2) → c_2Segment(L_2, M_2) → d_2Segment(N_2, U_2) → e_2Segment(O_2, V_2) → f_2Segment(P_2, W_2) → g_2Segment(Q_2, Y_2) → h_2Segment(R_2, Z_2) → i_2Segment(S_2, A_3) → j_2Segment(T_2, B_3) → k_2Segment(A, C_3) → bSegment(C_3, D_3) → dSegment(D_3, E_3) → l_2Segment(E_3, A) → m_2GCD(fracnumunred, fracdenomunred) → ReduceBy
AI Drawing Prompt Reference
Draw a geometric diagram to demonstrate the conversion relationships among fractions, decimals, and percentages. Start by drawing a circle with a center and diameter, then draw a perpendicular line from the center to the diameter, forming a right triangle. Rotate the triangle 90 degrees to get two new points, and connect them. Next, find intersection points on the perpendicular line with the rotated line segment, and connect these points to form a quadrilateral. Finally, add some auxiliary line segments and lines to show proportions and area relationships, making the numerical conversions and geometric applications clearer.
The prompt above was compiled from the original drawing commands and is for reference only.