
Fractions and Decimals: Visual Conversion with Geometric Representation
Loading the math board and drawing, please wait…
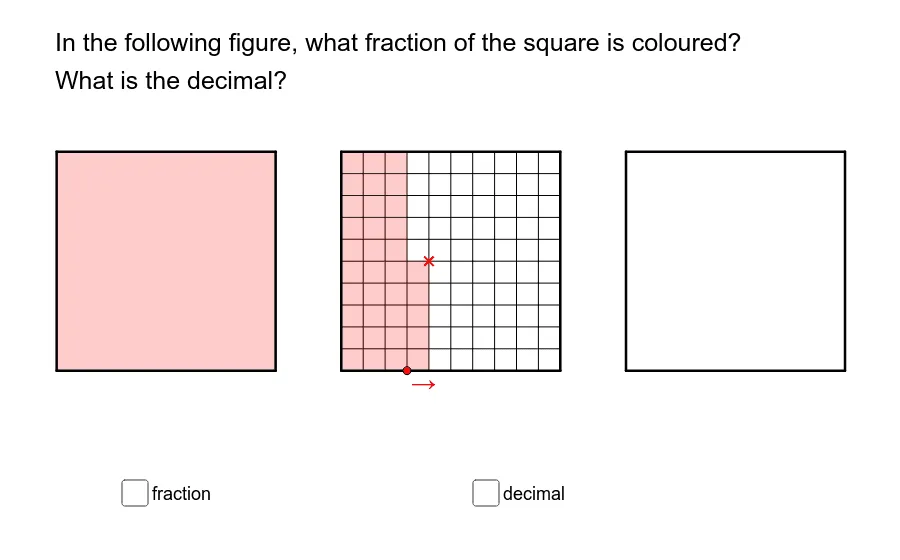
This GeoGebra example dynamically demonstrates the relationship between fractions and decimals through visual partitioning and number line marking. It shows how a fraction can be represented as a geometric area (polygons) and simultaneously as a decimal value, reinforcing the equivalence between the two notations. Core mathematical concepts include fraction meaning, decimal representation, division, and the correspondence between numbers and points on a number line. The construction uses commands such as Corner, Point, Polygon, If, and Sequence to create dynamic shapes and sequences, with multiple polygon objects (poly3 to poly8) representing fractional parts and text objects (text1) displaying numerical labels. Suitable for upper elementary and middle school students learning fraction-decimal conversion, as well as for teachers demonstrating these concepts interactively in class.
GeoGebra Commands & Parameters
Corner(5) → A_1Point(Sequence[(k, 0), k, 0, 3.6, 0.1]) → APoint(Sequence[(x(A) + 0.1, j), j, 0, 1, 0.1]) → BPolygon((1.3, 0), (2.3, 0), (2.3, 1), (1.3, 1)) → poly3, i, j, k, lPolygon((2.6, 0), (3.6, 0), (3.6, 1), (2.6, 1)) → poly4, m, n, p, qIf((x(A) ≥ 1) ∧ (x(A) < x(Vertex[poly3, 1])) ∨ (x(A) ≥ x(Vertex[poly3, 2])) ∧ (x(A) < x(Vertex[poly4, 1])) ∨ x(A) ≟ x(Vertex[poly4, 2]), true, false) → integerPolygon(A, A + (0.1, 0), A + (0.1, If[integer, 0, y(B)]), A + (0, If[integer, 0, y(B)])) → poly8, j_1, k_1, l_1, m_1Polygon((0, 0), (Min[x(A), 1], 0), (Min[x(A), 1], 1), (0, 1)) → poly5, r, s, t, a_1Polygon((x(Vertex[poly3, 1]), 0), (Max[Min[x(A), x(Vertex[poly3, 1]) + 1], x(Vertex[poly3, 1])], 0), (Max[Min[x(A), x(Vertex[poly3, 1]) + 1], x(Vertex[poly3, 1])], 1), (x(Vertex[poly3, 1]), 1)) → poly6, b_1, c_1, d_1, e_1Polygon((x(Vertex[poly4, 1]), 0), (Max[Min[x(A), x(Vertex[poly4, 1]) + 1], x(Vertex[poly4, 1])], 0), (Max[Min[x(A), x(Vertex[poly4, 1]) + 1], x(Vertex[poly4, 1])], 1), (x(Vertex[poly4, 1]), 1)) → poly7, f_1, g_1, h_1, i_1Polygon((0.8187524918794742, 1.1041021645196354), (1.818752491879475, 1.1041021645196354), (1.818752491879475, 2.1041021645196336), (0.8187524918794742, 2.1041021645196336)) → poly1, a, b, c, dPolygon((0, 0), (1, 0), (1, 1), (0, 1)) → poly2, e, f, g, hSequence(Segment[(0, j), (1, j)], j, 0, 1, 0.1) → list4Sequence(Segment[(x(Vertex[poly3, 1]), j), (x(Vertex[poly3, 1]) + 1, j)], j, 0, 1, 0.1) → list5Sequence(Segment[(x(Vertex[poly4, 1]), j), (x(Vertex[poly4, 1]) + 1, j)], j, 0, 1, 0.1) → list6Sequence(Segment[(i, 0), (i, 1)], i, 0, 1, 0.1) → list1Sequence(Segment[(x(Vertex[poly3, 1]) + i, 0), (x(Vertex[poly3, 1]) + i, 1)], i, 0, 1, 0.1) → list2Sequence(Segment[(x(Vertex[poly4, 1]) + i, 0), (x(Vertex[poly4, 1]) + i, 1)], i, 0, 1, 0.1) → list3If(y(B) < 1, 100 * poly8, 0) → hundredthdigit
AI Drawing Prompt Reference
Create a visual for fraction-to-decimal conversion. Draw a coordinate plane with a unit square from (0,0) to (1,1), divided into a 10 by 10 grid using horizontal and vertical lines. To its right, add two more unit squares, from x=1 to 2 and x=2 to 3, each also divided into 10 by 10 grids. Place a draggable point along the x-axis from 0 to 3.6, and another point moving vertically from 0 to 1. Based on the horizontal point's position, fill the covered portion of the current unit square with a colored polygon, and similarly fill corresponding parts in the two right squares. Show a text label displaying the decimal value (e.g., hundredths). The graphic emphasizes the equivalence between shaded area and decimal notation.
The prompt above was compiled from the original drawing commands and is for reference only.