
Fraction Pie Chart
Loading the math board and drawing, please wait…
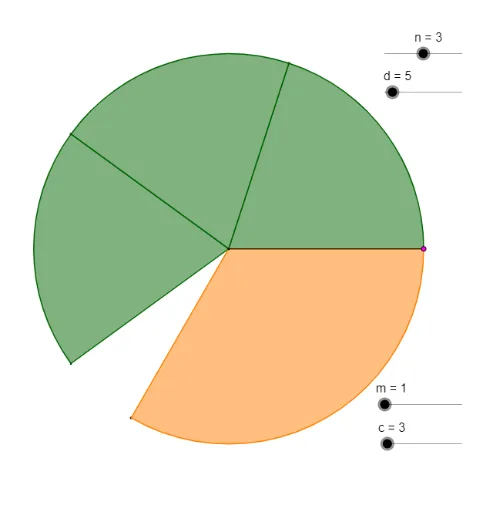
This example demonstrates how to create a fraction pie chart using GeoGebra, visually representing the relationship between fractions and circle area. It involves core mathematical concepts such as fractions, circle area, angles, sequences and series, congruence and symmetry, linear programming and optimization, and curve sketching. The construction uses commands like Segment, Point, Intersect, and Sequence, as outlined in the summary. Suitable for middle school and above, ideal for math education and geometric constructions.
GeoGebra Commands & Parameters
Segment((0.5, 0), (1, 0)) → ePoint(e) → AIntersect(xAxis, yAxis) → OSegment(O, A) → rSequence((r * (cos((k * b)) - (ί * sin((k * b))))), k, 0, m) → qSequence(cos((k * a)) + (ί * sin((k * a))), k, 0, n) → pSequence(CircleSector[O, Element[p, k], Element[p, k + 1]], k, 1, n) → spSequence(CircleSector[O, Element[q, k + 1], Element[q, k]], k, 1, m) → sq
AI Drawing Prompt Reference
Create a fraction pie chart using a circle to visually represent fraction relationships. Connect the center point to the x-axis and y-axis intersection to form a radius. Draw two sequences of sectors centered at the origin, one in a clockwise direction and the other in a counterclockwise direction, with alternating coverage to show different fraction proportions. Use sliders to adjust the number of sequences and angles, demonstrating geometric construction and optimization.
The prompt above was compiled from the original drawing commands and is for reference only.