
Fraction Machine: Interactive Visual Model for Fractions
Loading the math board and drawing, please wait…
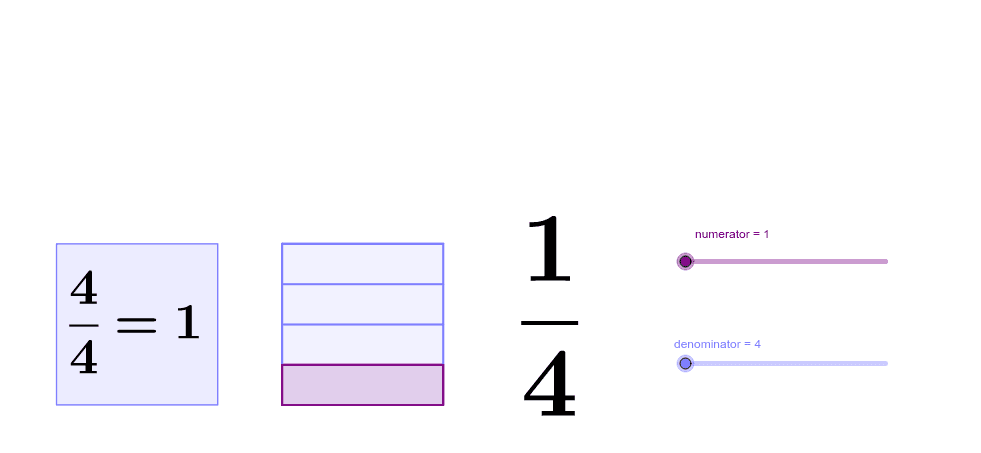
① This example demonstrates an interactive geometric model that visualizes fractions by showing the relationship between numerator and denominator, helping learners grasp the numerical meaning of fractions. ② Core mathematical concepts include fractions, numerator, denominator, partitioning, and part-whole relationships, represented through polygon areas or length ratios. ③ Construction uses GeoGebra commands such as Intersect, Point, Polygon, and Sequence, creating multiple polygons (poly1, poly2, poly3) and points (A, B, C, D, E, F, G, H), with lists (list1, list2) and texts (text1, text2) displaying numerator and denominator values, adjustable via sliders or dynamic objects. ④ Suitable for upper elementary to middle school students learning fraction concepts, and useful for teacher demonstrations or student self-exploration of the correspondence between fractions and geometric shapes.
GeoGebra Commands & Parameters
Intersect(xAxis, yAxis) → APoint(xAxis) → BPolygon(A, B, 4) → poly1, a, b, c, d, C, DSequence(Segment[(0, (i / denominator * 10)), (10, (i / denominator * 10))], i, 1, denominator, 1) → list1Polygon((0, 0), (10, 0), (10, (10 * numerator / denominator)), (0, (10 * numerator / denominator))) → poly2, e, f, g, hSequence(Segment[(0, (10 * i / denominator)), (10, (10 * i / denominator))], i, denominator + 1, numerator, 1) → list2Point(xAxis) → EPoint(xAxis) → FPolygon(E, F, 4) → poly3, i, j, k, l, G, H
AI Drawing Prompt Reference
Create an interactive model to visualize fractions by showing the relationship between numerators and denominators using polygon areas or length ratios. Include two main parts: a polygon with four vertices and a trapezoid whose height and width are controlled by sliders for the numerator and denominator. Place three points on the x-axis and construct three quadrilaterals based on these points. Divide the top base of the trapezoid into segments equal to the denominator with two lines, highlighting each segment in different colors.
The prompt above was compiled from the original drawing commands and is for reference only.