
Fraction Circular Model
Loading the math board and drawing, please wait…
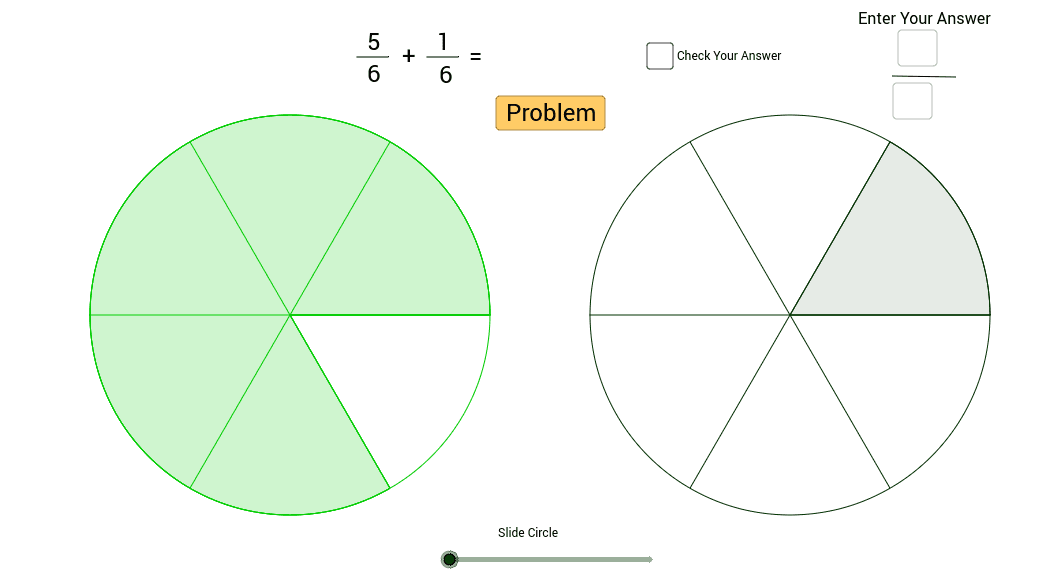
This example demonstrates a circular model for visualizing fraction addition, where problems are generated with denominators no larger than twelve and numerators adjusted so that the sum is never greater than 1. It involves core math concepts like fraction addition, circular sectors, and value constraints. Constructed using GeoGebra commands like Sequence, RandomElement, Point, Sector, Segment, Length, Textfield, Rotate. Suitable for middle school mathematics teaching to intuitively understand fraction addition operations.
GeoGebra Commands & Parameters
Sequence(t, t, 2, 12, 1) → list3RandomElement(list3) → denomRandomElement(list3) → DenominatorSequence(t, t, 1, Denominator - 1, 1) → list4RandomElement(list4) → NumeratorSequence(t, t, 1, Denominator_2 - Numerator) → list5Point(xAxis) → ASector(c, 0, ((360 * ° / Denominator) * Numerator)) → eSequence(Segment[(x(A) + a, y(A)), (a + (4 * cos(θ)), (4 * sin(θ)))], θ, 0*°, 360*°, (360 * ° / Denominator)) → list1Sequence(Segment[(x(A) + 10, y(A)), (10 + (4 * cos(θ)), (4 * sin(θ)))], θ, 0*°, 360*°, (360 * ° / Denominator_2)) → list2Segment(B, C) → bLength(Text[Denominator]) → iSegment(F, G) → kLength(Text[Numerator]) → lLength(Text[Denominator_2]) → mSegment(H, I) → pSegment(J, K) → qTextfield(A1) → inputBox1Textfield(A2) → inputBox2RandomElement(list5) → Numerator_2Sector(d, 0, ((360 * ° / Denominator) * Numerator_2)) → fRotate(e, (a / 10 * ((360 * ° / Denominator) * Numerator_2)), (a, 0)) → e'Sequence(t, t, 1, Denominator_2 - Numerator) → List5Length(Text[Numerator + Numerator_2]) → g
AI Drawing Prompt Reference
Draw a circular model to visualize fraction addition, with denominators no larger than twelve and numerators adjusted so that the sum is never greater than one. Use different-sized sectors to represent each fraction, connecting the sectors with lines to show the process of adding fractions. Include sliders to control the denominators and numerators, and use text annotations to label the fractions. Start by drawing the base circle and sectors, then add connecting lines and text annotations, and finally adjust the sliders to show the change in fractions.
The prompt above was compiled from the original drawing commands and is for reference only.