
FR Boxplots: Comprehensive Demonstration of Normal Distribution and Statistics
Loading the math board and drawing, please wait…
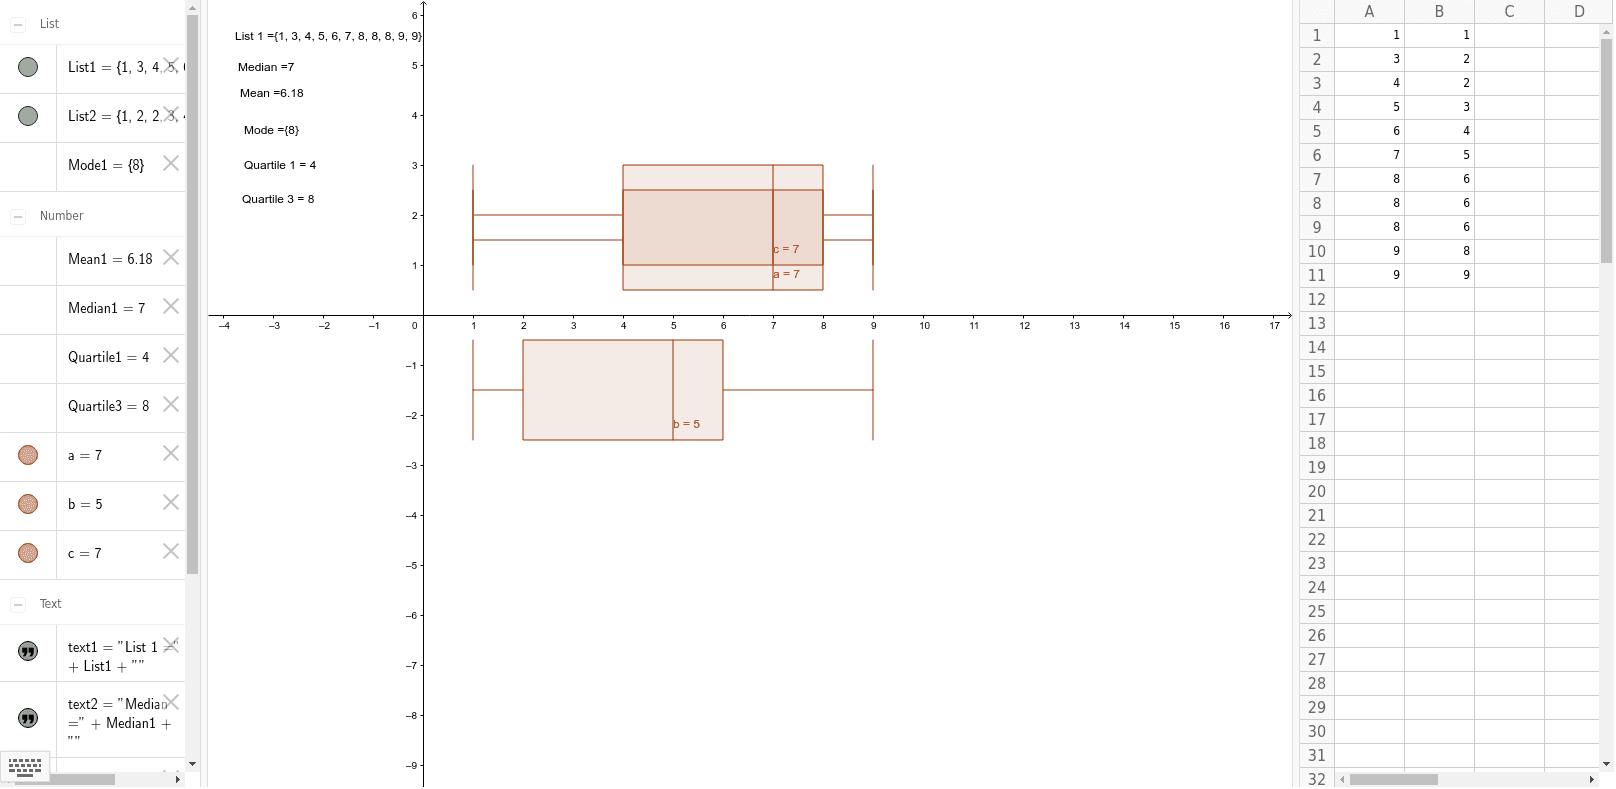
① This GeoGebra example dynamically displays boxplots for a dataset, simultaneously showing mean, median, mode, quartiles, and other statistics, providing an intuitive view of data distribution. ② Core mathematical concepts include boxplots, five-number summary (minimum, Q1, median, Q3, maximum), mean, median, mode, quartiles, and the application of normal distribution and logic in statistics. ③ Construction highlights: uses the BoxPlot command to draw boxplots, Mean, Median, Mode, Q1, Q3 commands to compute statistics, lists List1 and List2 to store data, objects A1-A11 and B1-B11 as data points, parameters a, b, c, and text1-text6 for labels, building an interactive statistical teaching tool. ④ Suitable for high school and introductory college statistics courses, to understand data distribution characteristics, compare central tendency and dispersion of different datasets, and for classroom demonstrations in AP Statistics or IB Mathematics.
GeoGebra Commands & Parameters
BoxPlot(1.5, 1, List1) → aBoxPlot(-1.5, 1, List2) → bMean(List1) → Mean1Median(List1) → Median1Mode(List1) → Mode1Q1(List1) → Quartile1Q3(List1) → Quartile3BoxPlot(2, 1, List1) → c