
Fourier Decomposition of cos(x)^5
Loading the math board and drawing, please wait…
In collections
UNSW MATH1131/1231 Algebra material
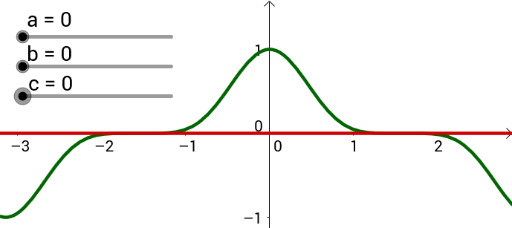
This GeoGebra example visualizes the Fourier decomposition of the function cos(x)^5, demonstrating how a periodic function can be expressed as a sum of harmonic sine and cosine terms. It illustrates the core mathematical concepts of Fourier series, trigonometric identities, and harmonic superposition, showing the approximation of a function by its frequency components. The construction uses GeoGebra commands such as Text to create labels, and defines objects f, a, b, c, g, d, and text1 to represent the original function, individual harmonic terms, their combination, and the displayed expression. This is suitable for high school to university students learning calculus, signal processing, or mathematical analysis, providing an intuitive grasp of Fourier analysis and the orthogonality of trigonometric functions.
GeoGebra Commands & Parameters
Text(("Error: " * d)) → text1
AI Drawing Prompt Reference
Create a mathematical illustration showing the Fourier decomposition of cos(x)^5. Display the original function curve prominently, alongside several harmonic component curves representing sine and cosine terms at different frequencies. Show how these harmonics combine to approximate the original function. Include a text label displaying the error of the decomposition. Arrange the elements clearly to emphasize the relationship between the function, its harmonics, and their superposition.
The prompt above was compiled from the original drawing commands and is for reference only.