
Flatten the Curve (SIR Model & Social Distancing)
Loading the math board and drawing, please wait…
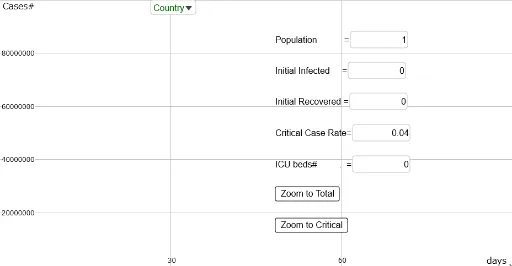
This app simulates pandemics and social distancing based on the SIR model. It uses concepts from calculus and coordinate geometry to demonstrate how parameters can control the spread of an epidemic. It employs GeoGebra commands such as polynomial fitting and differential equation solving, suitable for high school and above students or educators.
GeoGebra Commands & Parameters
OrthogonalLine((90, 0), xAxis) → t3Point(t3) → SD_{3}OrthogonalLine((60, 0), xAxis) → t2Point(t2) → SD_{2}OrthogonalLine((30, 0), xAxis) → t1Point(t1) → SD_{1}OrthogonalLine((0, 0), xAxis) → t0Point(t0) → SD_{0}Polynomial({SD_{0}, SD_{1}, SD_{2}, SD_{3}}) → SDNSolveODE({S', I', R'}, 0, {S_{0}, I_{0}, R_{0}}, TimeSpan) → SIRt, SIRt_{2}, SIRt_{3}Length(SIRt_{2}) → IlenOrthogonalLine((120, 0), xAxis) → t4Point(t4) → SD_{4}OrthogonalLine((150, 0), xAxis) → t5Point(t5) → SD_{5}OrthogonalLine((180, 0), xAxis) → t6Point(t6) → SD_{6}OrthogonalLine((0, ICUbeds), yAxis) → ICUTextfield(Population) → PopulationInputTextfield(I_{0}) → I_0InputTextfield(R_{0}) → R_0InputFirst(SIRt_{2}, Ilen) → ItFitPoly(It, 56) → IpolyTextfield(CriticalRate) → CriticalRateInputTextfield(ICUbeds) → ICUbedsInputSelectedIndex(CountryList) → SelectedCountryMax(Ipoly, 0, TimeSpan) → ImaxP
AI Drawing Prompt Reference
Draw a graph simulating pandemic spread, including the x-axis and four points representing social distancing at 0, 30, 60, and 90 units from left to right. Fit a polynomial curve through these points, and simulate the epidemic spread with a differential equation showing the number of infected individuals over time. Add a vertical line above the x-axis for ICU beds and label the peak of the infected curve. Include input fields for population, initial infected, initial recovered, ICU beds, and critical rate, along with a dropdown menu to select countries.
The prompt above was compiled from the original drawing commands and is for reference only.