
Fitting a Sine Equation from Data
Loading the math board and drawing, please wait…
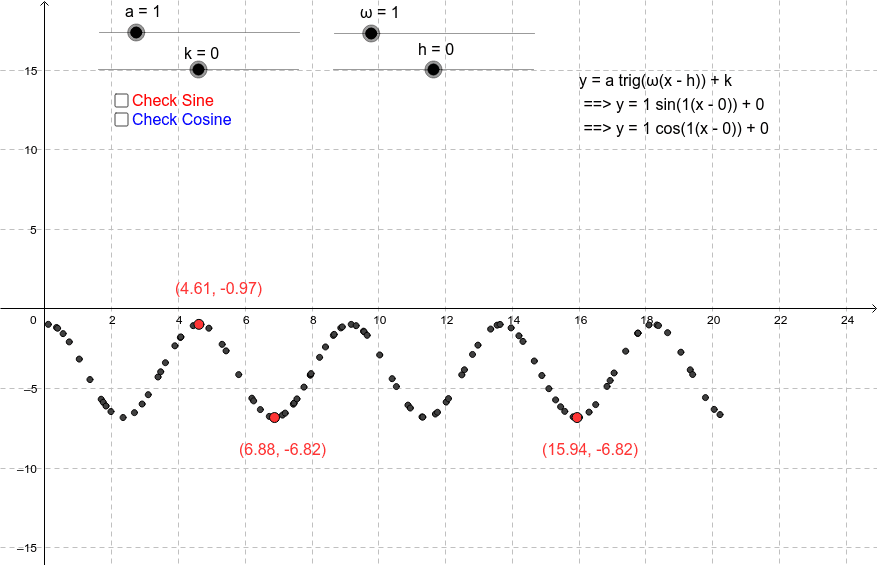
This example demonstrates how to fit a sine equation to data points, illustrating the process of matching data with a sine function. Core math concepts include trigonometric functions, least squares method, and data fitting. Construction involves using the Random command to generate data points and objects A1-A36 representing their coordinates. Suitable for high school mathematics teaching, helping students understand function fitting and parameter adjustment in practical applications.
GeoGebra Commands & Parameters
Random(1, 2) → max_{or}min
AI Drawing Prompt Reference
Draw a set of randomly generated data points and fit a sine function to them. First, generate random numbers between 1 and 2 as the y-coordinates of the points. Then, plot these points on a Cartesian coordinate system. Next, fit a sine function to these points by adjusting parameters such as amplitude, period, and phase to make the curve as close as possible to the points.
The prompt above was compiled from the original drawing commands and is for reference only.