
Finding the rule for ax + by = c graphs
Loading the math board and drawing, please wait…
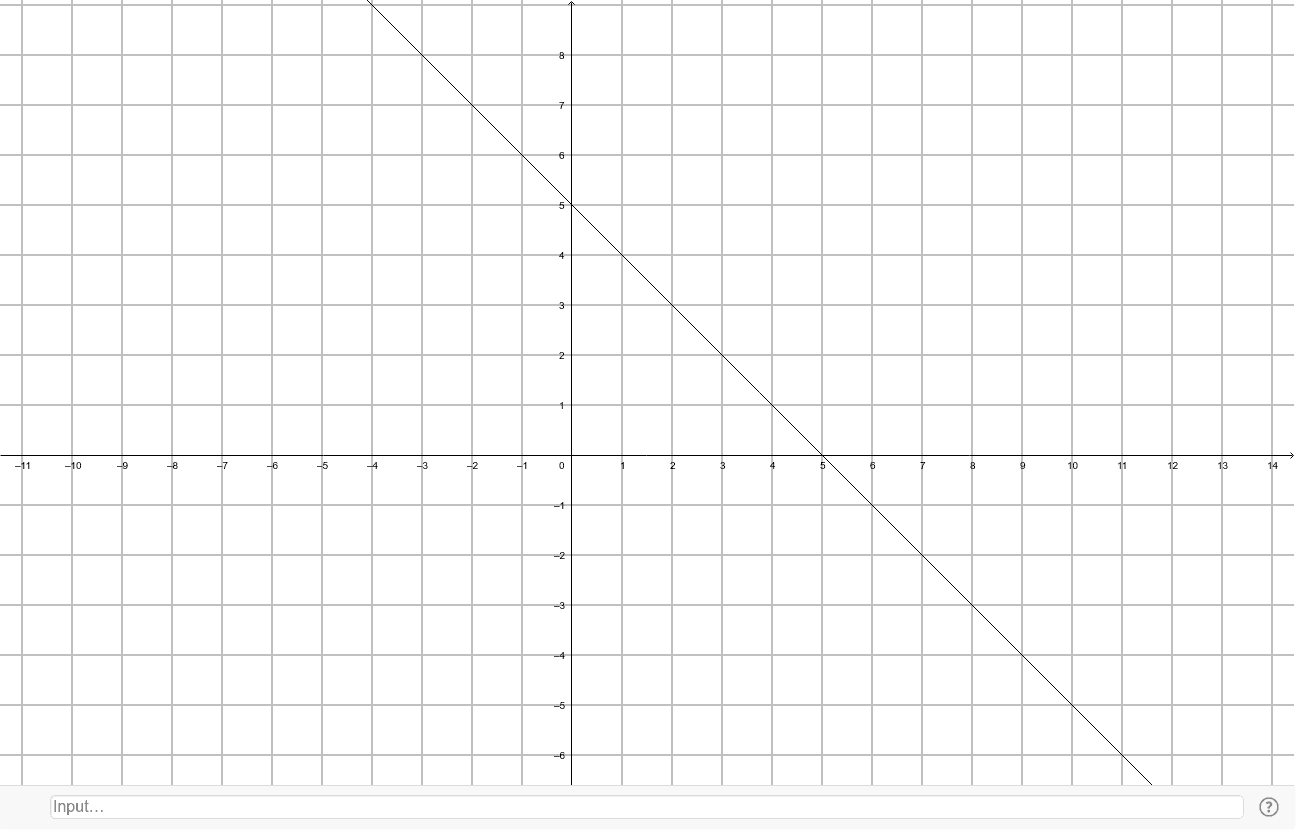
This example demonstrates how to identify the function rule by plotting points that lie on a line. Core math concepts include linear equations, coordinate geometry, and function graphing. It involves using GeoGebra commands like 'Object: a' to construct the graph. Suitable for middle school students and above to learn about the properties of linear functions.
GeoGebra Commands & Parameters
Line a(1.0, 1.0, -5.0)
AI Drawing Prompt Reference
Draw a straight line passing through the point (1,1) and parallel to the y-axis, extending to the left until x=-5, to demonstrate how to find the rule of a linear function by plotting points on the line, suitable for middle school students and above learning about linear equations and coordinate geometry.
The prompt above was compiled from the original drawing commands and is for reference only.