
Finding P-value for Sample Mean
Loading the math board and drawing, please wait…
In collections
Statistics Demonstrations
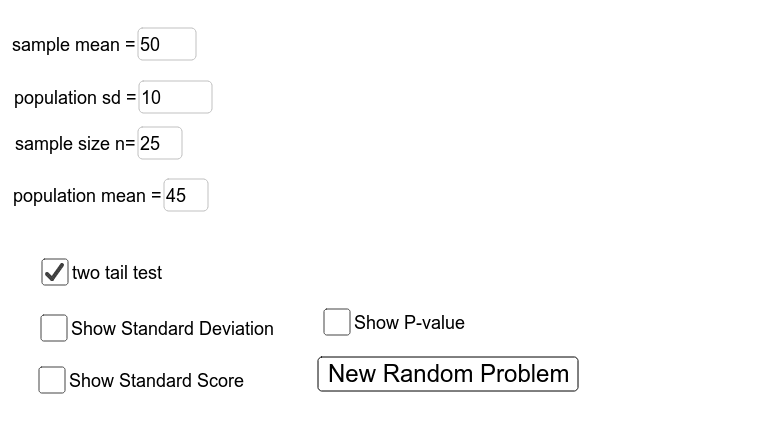
This example demonstrates how to find the P-value for a sample mean given the population mean, standard deviation, sample size, and sample mean. It involves concepts from probability and statistics, specifically hypothesis testing. GeoGebra commands such as Textfield, Normal, Min, and If are used to construct the graph. Suitable for high school and above students or teachers.
GeoGebra Commands & Parameters
Textfield(populationMean) → inputPopulationMeanTextfield(n) → inputSampleSizeTextfield(sampleMean) → inputSampleMeanTextfield(populationSD) → inputPopulationSDNormal(0, 1, StandardScore) → P1Min(P1, 1 - P1) → P2If(a, (2 * P2), P2) → PIf(a, "two", "one") → tails
AI Drawing Prompt Reference
Create a statistical diagram showing how to calculate the P-value given the population mean, standard deviation, sample size, and sample mean. Include input fields for users to enter the population mean, sample size, sample mean, and population standard deviation. Plot a normal distribution curve, calculate the standard score, find the P-value from the standard score, determine if it's a two-tailed or one-tailed test based on the P-value and sample size, and display the P-value result.
The prompt above was compiled from the original drawing commands and is for reference only.