
Finding Limits Graphically
Loading the math board and drawing, please wait…
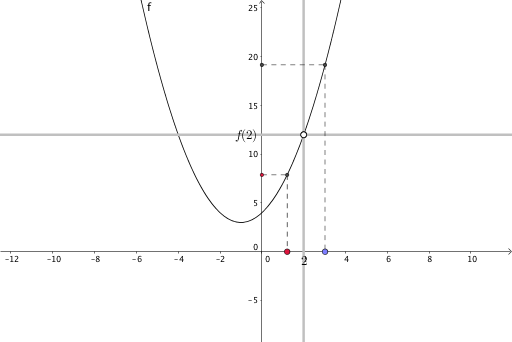
This example demonstrates the concept of limits through graphical representation. Core mathematical concepts include function limits. Construction highlights include using GeoGebra commands to create function graphs, points, and segments.
GeoGebra Commands & Parameters
OrthogonalLine(B, xAxis) → gOrthogonalLine(B, yAxis) → hPoint(xAxis) → COrthogonalLine(C, xAxis) → iIntersect(f, i, (1.2103, 7.885426089999999)) → DOrthogonalLine(D, yAxis) → jIntersect(j, yAxis) → ESegment(E, D) → kSegment(D, C) → lPoint(xAxis) → FOrthogonalLine(F, xAxis) → mIntersect(f, m, (3.02046, 19.1640986116)) → GOrthogonalLine(G, yAxis) → nIntersect(n, yAxis) → HSegment(H, G) → pSegment(G, F) → qPoint(n) → I
AI Drawing Prompt Reference
Draw a function graph and illustrate the concept of limits. Start by plotting the x and y axes. Take a point on the x-axis, draw a perpendicular line to the function graph, and mark the intersection as D. From D, draw perpendicular lines to the x and y axes, marking intersections as C and E respectively. Connect C to D and D to E. Repeat the process for another point on the x-axis to get two more points and segments.
The prompt above was compiled from the original drawing commands and is for reference only.