
Filling Rate of a Sphere
Loading the math board and drawing, please wait…
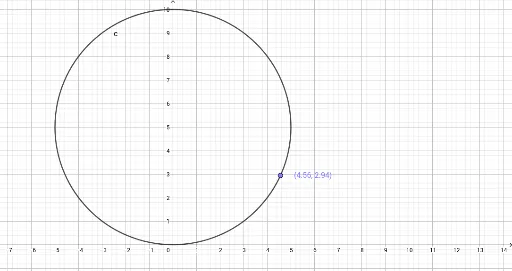
This example demonstrates the filling rate of a sphere, involving related rates in calculus. It shows how to calculate the filling rate as a function of time by constructing the volume changes of the sphere. The Point command is used to create key points such as R, c, and A. Suitable for high school and above students to learn about related rates problems.
GeoGebra Commands & Parameters
Point(c) → A
AI Drawing Prompt Reference
Draw a 3D sphere illustrating its filling process over time. Inside the sphere, draw a radius line from the center to the surface, and mark a dynamic point on this radius representing the intersection of the current liquid level with the radius. From this point, draw a vertical dashed line down to the bottom of the sphere to indicate the liquid height. Additionally, outside or beside the sphere, show a curve representing the filling rate as a function of time, starting from the origin and rising, reflecting that the rate decreases as the liquid level increases. The overall figure should clearly show the geometric and mathematical relationships among the sphere, radius, dynamic point, and rate curve.
The prompt above was compiled from the original drawing commands and is for reference only.