
Features from ValueTables
Loading the math board and drawing, please wait…
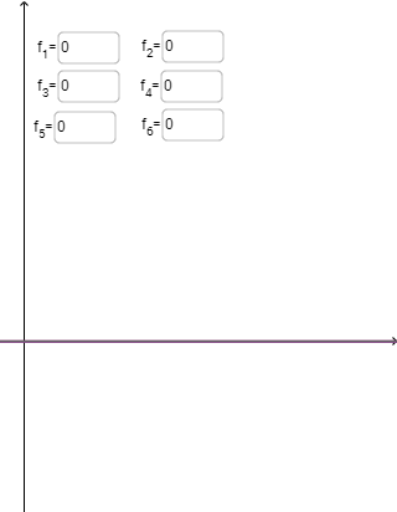
This example demonstrates features from value tables, involving limits, statistics, and arithmetic. Using TableText and Textfield commands, it constructs tables and inputs text, showcasing how to extract features from value tables. Suitable for high school mathematics education and learning.
GeoGebra Commands & Parameters
TableText({{a, b}, {A2, B2}, {A3, B3}, {A4, B4}, {A5, B5}, {A6, B6}, {A7, B7}, {A8, B8}}, "|_r") → text1TableText({{a, b_1}, {A10, B10}, {A11, B11}, {A12, B12}, {A13, B13}, {A14, B14}, {A15, B15}, {A16, B16}}, "|_r") → text2TableText({{a, b_2}, {A18, B18}, {A19, B19}, {A20, B20}, {A21, B21}, {A22, B22}, {A23, B23}, {A24, B24}}, "|_r") → text3TableText({{a, b_3}, {D2, E2}, {D3, E3}, {D4, E4}, {D5, E5}, {D6, E6}, {D7, E7}, {D8, E8}, {D9, E9}}, "|_r") → text4TableText({{a, b_4}, {D11, E11}, {D12, E12}, {D13, E13}, {D14, E14}, {D15, E15}, {D16, E16}, {D17, E17}}, "|_r") → text5TableText({{a, b_5}, {D19, E19}, {D20, E20}, {D21, E21}, {D22, E22}, {D23, E23}, {D24, E24}, {D25, E25}}, "|_r") → text6Textfield(f_1) → InputBox1Textfield(f_3) → InputBox3Textfield(f_4) → InputBox4Textfield(f_6) → InputBox6Textfield(f_5) → InputBox5Textfield(f_2) → InputBox2
AI Drawing Prompt Reference
Create a graphic with multiple tables and input boxes, containing numerical pairs like (a, b) and (A2, B2), and demonstrate statistical and limit features. Use the TableText command to create tables and input statistical and limit information through text fields, and finally display these in input boxes.
The prompt above was compiled from the original drawing commands and is for reference only.