
Families of Functions Task
Loading the math board and drawing, please wait…
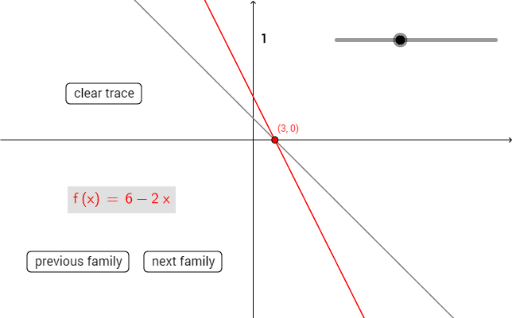
This example demonstrates the impact of parameters on function graphs, focusing on linear functions, logarithmic functions, and their intersections. Core mathematical concepts include function graphs, linear programming, equilateral triangles, logarithmic functions, and standard deviation. GeoGebra commands like Intersect and LaTeX are used to dynamically illustrate and interact with the functions and parameters. Suitable for high school and above mathematics education, covering function analysis, parameter effects, and optimization problems.
GeoGebra Commands & Parameters
Intersect(f, xAxis) → ALaTeX(f, true, true) → text1Intersect(g, yAxis) → BLaTeX(g, true, true) → text2LaTeX(h, true, true) → text4
AI Drawing Prompt Reference
Draw a series of linear and logarithmic functions to observe the impact of parameter changes on the function graphs. First, draw the linear function f and find its intersection with the x-axis. Then, draw the logarithmic function g and find its intersection with the y-axis. Finally, draw another logarithmic function h and display its equation.
The prompt above was compiled from the original drawing commands and is for reference only.