
Exponents - Grade 7: Intersections and Graphs
Loading the math board and drawing, please wait…
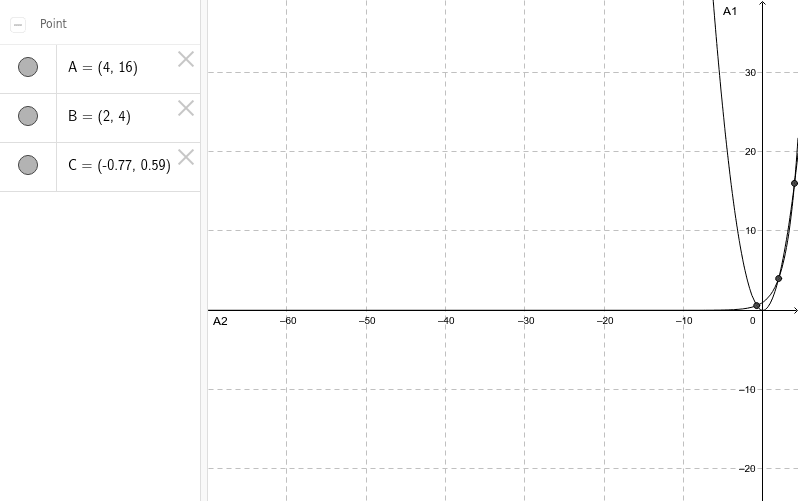
①This GeoGebra example dynamically illustrates exponent operations for Grade 7, focusing on intersections between exponential and linear graphs to visualize solutions. ②Core math concepts include exponent rules, function intersections, exponential growth versus linear change, with extensions to parametric curves and normal distribution. ③Construction uses the Intersect command on objects A1, A2, A, B, C to find common points, revealing where equations balance. ④Ideal for Grade 7 students learning exponents, teachers demonstrating function behavior, or as a bridge to more advanced topics like parametric equations and probability.
GeoGebra Commands & Parameters
Intersect(A1, A2, (4.000000000014535, 16.00000000011628)) → AIntersect(A1, A2, (2, 4)) → BIntersect(A1, A2, (-0.7666646959180926, 0.5877747559671814)) → C
AI Drawing Prompt Reference
Draw a coordinate plane with an exponential curve and a straight line intersecting at three distinct points. One intersection is in the upper right quadrant, another in the lower right quadrant, and the third in the lower left quadrant with negative coordinates. Clearly show the curve crossing the line at each intersection, and label the approximate coordinates of these points. The graph should illustrate the contrast between exponential growth and linear change, suitable for observing where the two functions balance.
The prompt above was compiled from the original drawing commands and is for reference only.