
Exponential & Logarithmic Functions Demo
Loading the math board and drawing, please wait…
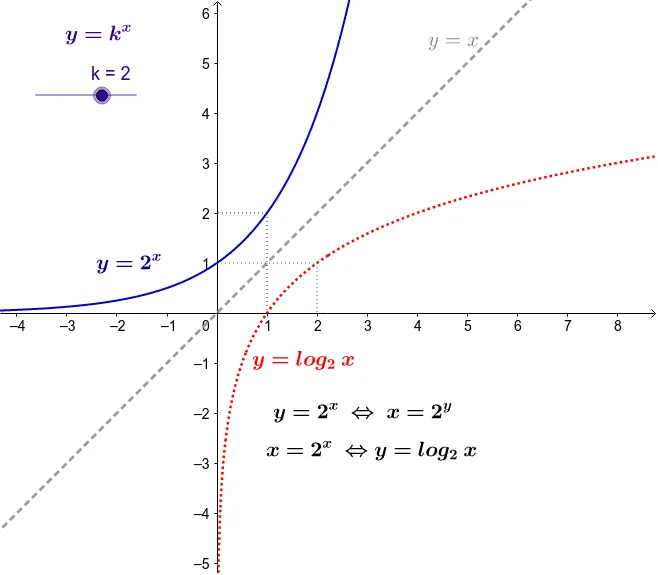
This example demonstrates the graphs and properties of exponential and logarithmic functions. Key math concepts include exponential functions, logarithmic functions, function graph transformations, derivatives, and integrals. It is constructed using GeoGebra commands like OrthogonalLine, Intersect, and Segment to create function graphs and auxiliary lines. Suitable for high school and above mathematics learners to understand function images and properties.
GeoGebra Commands & Parameters
OrthogonalLine(A, xAxis) → dIntersect(c, d, (1, 2)) → BOrthogonalLine(B, d) → eIntersect(e, yAxis) → CSegment(B, C) → gSegment(B, A) → hOrthogonalLine(D, yAxis) → iIntersect(f, i, (2.000000000016698, 1.0000000000120453)) → EOrthogonalLine(E, i) → jIntersect(j, xAxis) → FSegment(D, E) → lSegment(E, F) → m
AI Drawing Prompt Reference
Draw a graph demonstrating exponential and logarithmic functions, including their basic images and properties, as well as function graph transformations, derivatives, and integrals. Start by drawing the x-axis and y-axis, then create a perpendicular line to the x-axis and find its intersection with the y-axis. Connect these two points to form a line segment. Next, find another point on the x-axis, draw a perpendicular line, and find its intersection with the y-axis. Connect these two points to form another line segment. Finally, draw the area enclosed by these two line segments to showcase the function images and properties.
The prompt above was compiled from the original drawing commands and is for reference only.