
Exponential Log Relationship Demo
Loading the math board and drawing, please wait…
In collections
Complex Math
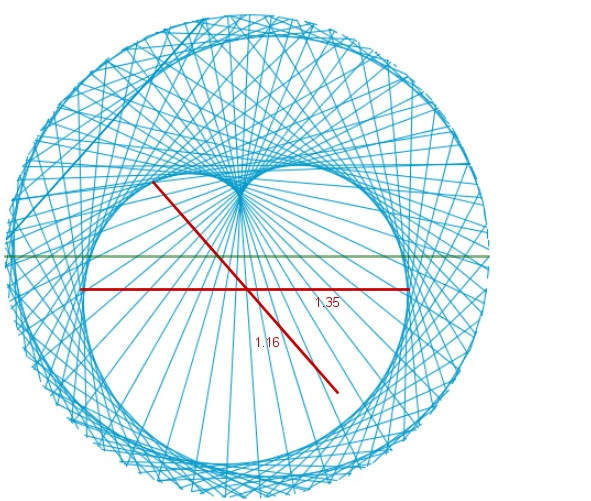
This example demonstrates the interrelation between exponential and logarithmic functions and their graphical representations. Core math concepts include exponential functions, logarithmic functions, derivatives, geometric transformations, etc. Constructed using GeoGebra commands like Textfield, Segment, Rotate, CircleArc, Distance, Intersect, Point, Mirror, Line, Vector, Translate for graphical construction and dynamic visualization. Suitable for high school students and teachers to understand function properties and geometric applications.
GeoGebra Commands & Parameters
Textfield(a) → InputBox1Segment(A, B) → fRotate(A, 32°, A) → A'Rotate(B, 32°, A) → B'CircleArc(C, H, I) → hSegment(H, I) → g_ΠDistance(K, L) → distanceKLDistance(M, N) → distanceMNSegment(N, M) → iSegment(L, K) → jSegment(K, N) → k_ΦSegment(M, L) → lIntersect(i, j) → OSegment(F, G_2) → mSegment(D, E) → pPoint(j) → RSegment(M, R) → qMirror(M, j) → M'Mirror(R, j) → R'Mirror(M, i) → M'_1Mirror(R, i) → R'_1Segment(M'_1, R'_1) → q'_1Segment(R', N) → sSegment(N, R'_1) → tPoint(j) → SSegment(R'_1, S) → rPoint(r) → TSegment(R, T) → a_1Distance(T, R'_1) → distanceTR'1Line(R'_1, t) → b_1Line(T, a_1) → c_1Segment(R'_1, T) → d_1Intersect(i, q) → USegment(T, U) → e_1Segment(C, B) → f_1Segment(C, A) → g_1Segment(R', U) → h_1Intersect(i, j) → VLine(V, h_1) → i_1Mirror(R', i_1) → R''Mirror(U, i_1) → U'Segment(R'', U') → j_1Line(V, s) → k_1Mirror(R', k_1) → R''_1Mirror(N, k_1) → N'Segment(R''_1, N') → s'Vector(W, Z) → uTranslate(R''_1, u) → A_1Translate(N', u) → N''Segment(A_1, N'') → s''Mirror(A_1, k_1) → B_1Mirror(N'', k_1) → N'''Segment(B_1, N''') → s'''Vector(C_1, D_1) → vTranslate(B_1, v) → E_1Translate(N''', v) → F_1Vector(G_1, H_1) → wTranslate(R'', w) → R'''Translate(U', w) → U''Segment(R''', U'') → l_1Point(j) → K_1Point(p) → L_1Segment(K_1, L_1) → m_1Point(p) → N_1Point(j) → O_1Segment(N_1, O_1) → q_1Point(i) → P_1Point(j) → Q_1Segment(P_1, Q_1) → r_1Point(f) → M_1Segment(M_1, R_1) → n_1Segment(M_1, S_1) → p_1Point(p) → T_1Segment(S_1, T_1) → s_1Segment(S_1, U_1) → t_1Segment(U_1, R_1) → a_2Segment(N_1, U_1) → b_2Segment(V_1, W_1) → c_2Segment(Z_1, A_2) → d_2
AI Drawing Prompt Reference
Draw a graph demonstrating the relationship between exponential and logarithmic functions. Start by drawing a base line and then create two line segments rotated 32 degrees from points on the base line. Next, draw an arc centered at one endpoint of the segments. Connect the endpoints of the arc to the base line with two segments. Calculate the distance between the segments and use it to draw two parallel lines. Finally, construct symmetric parts of the graph through rotation and translation, and include a vector to represent dynamic transformations.
The prompt above was compiled from the original drawing commands and is for reference only.