
Exponential Growth or Decay Identification
Loading the math board and drawing, please wait…
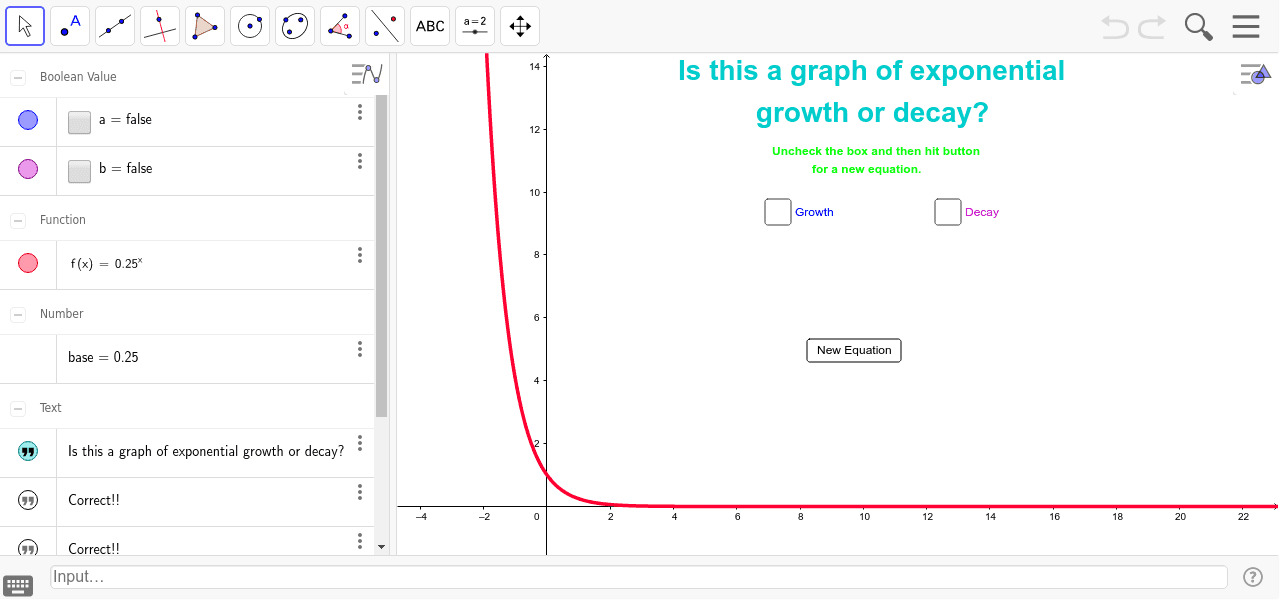
This example demonstrates how to determine if an exponential function graph represents growth or decay. It involves core math concepts like the properties of exponential functions and their graphical characteristics. Construction highlights include using GeoGebra's RandomUniform command to generate a random base, the f object for the exponential function, and text objects (text1-text6) for displaying information. Parameters a and b might be used for settings, and button1 for interaction. Suitable for high school mathematics teaching, aiding students in understanding the practical applications and graphical analysis of exponential functions.
GeoGebra Commands & Parameters
RandomUniform(0, 3) → base
AI Drawing Prompt Reference
Create an exponential function graph using a randomly generated base between 0 and 3 to represent growth or decay. Construct the function f(x) = base^x and display the graph. Add text to explain the function's properties and graphical characteristics, including the criteria for determining growth or decay.
The prompt above was compiled from the original drawing commands and is for reference only.