
Exponential Growth of Streptococcus lactis: Doubling Every 26 Minutes
Loading the math board and drawing, please wait…
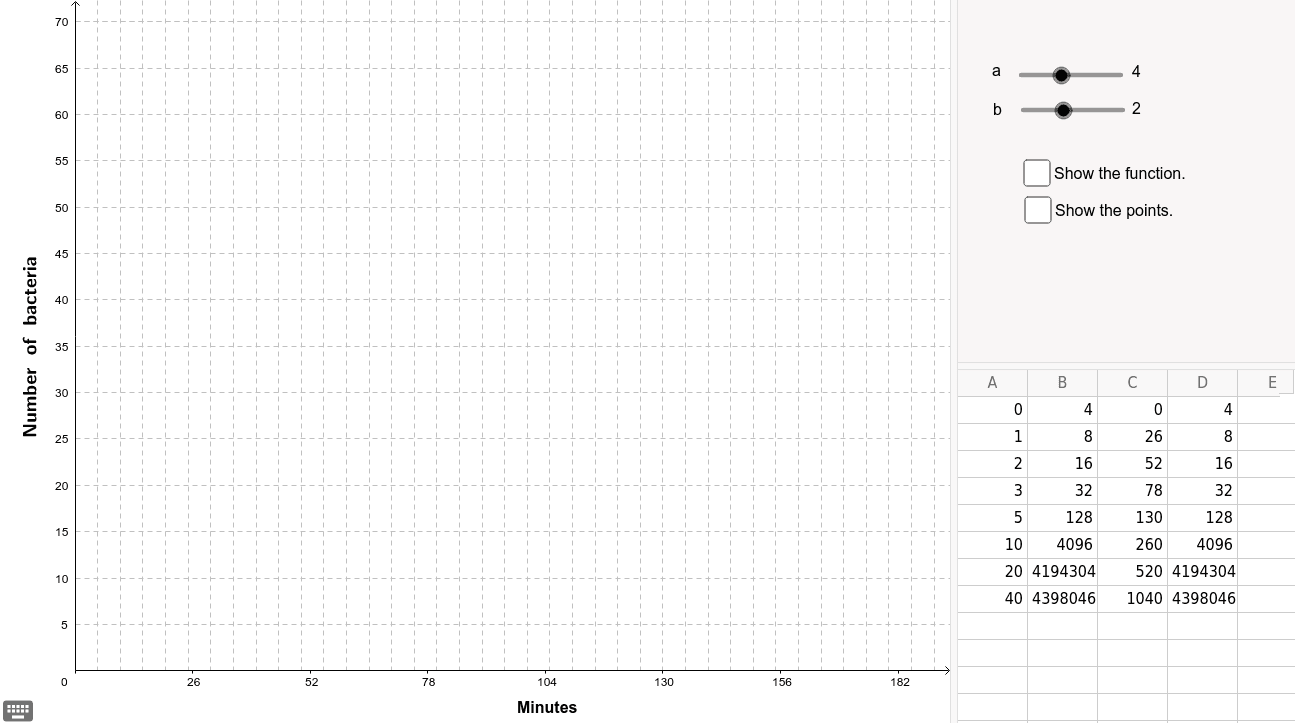
①This example demonstrates the exponential growth of bacteria in milk, showing how the population increases over time with dynamic graphics and text. ②Core math concepts include exponential functions and exponential growth models, involving initial value, doubling time, and function equations. ③Construction uses GeoGebra commands such as VerticalText for vertical labels, and multiple objects (a, b, f, c, text1, A1-A8, B1-B8, C1-C8, D1-D4, button1, sh, d) to create an interactive interface, possibly with sliders for time or doubling count and a button for animation. ④Suitable for middle/high school math or biology applications, helping students understand exponential growth in real-world contexts and function modeling.
GeoGebra Commands & Parameters
VerticalText("Number \ of \ bacteria") → text2
AI Drawing Prompt Reference
Create a dynamic graph showing the exponential growth of bacteria in milk, featuring a curve that increases with time and text indicating the number of bacteria over time. Include a point representing the initial value, a slider to control time or growth cycles, and a button to start the animation. The design should illustrate exponential functions and growth models, suitable for middle/high school students to understand real-world exponential growth phenomena.
The prompt above was compiled from the original drawing commands and is for reference only.