
Exponential Functions and Euler's Number e: Derivative Exploration
Loading the math board and drawing, please wait…
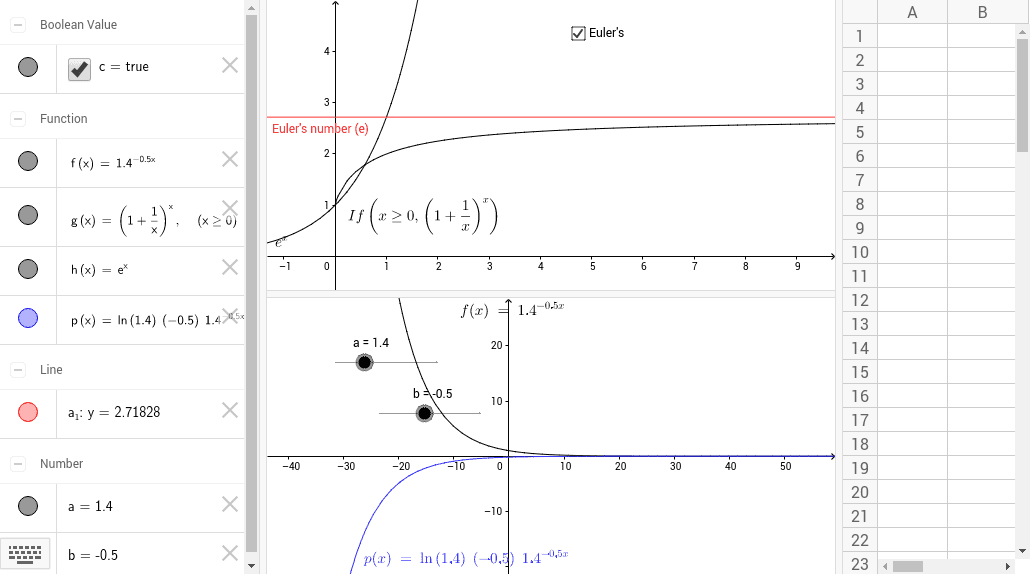
This GeoGebra example demonstrates how exponential functions and their derivatives change as the base varies, with special emphasis on Euler's number e, where the exponential function is equal to its own derivative. Core mathematical concepts covered include exponential functions, derivatives, Euler's number, function graphing, transformations, symmetry, and arithmetic operations. The construction relies on GeoGebra commands If and Derivative, utilizing objects a_1, g, a, b, f, h, c, p to define functions, compute derivatives, and control conditional display and dynamic behavior. It is suitable for high school calculus introductions and university-level mathematical analysis, serving as a classroom demonstration tool or an interactive resource for independent exploration of exponential derivative properties.
GeoGebra Commands & Parameters
If(x ≥ 0, (1 + 1 / x)^(x)) → gDerivative(f) → p
AI Drawing Prompt Reference
Draw a graph showing how exponential functions and their derivatives change as the base varies, with special focus on Euler's number e where the function equals its derivative. Include the exponential function curve and its derivative curve, dynamically adjusting the base to show the relationship. Highlight the special symmetry at e. First plot the exponential function, then compute and plot its derivative, finally emphasizing the overlap at e with conditional display.
The prompt above was compiled from the original drawing commands and is for reference only.