
Exponential Function Transformations by GreenMaths (3)
Loading the math board and drawing, please wait…
In collections
Transforming Functions
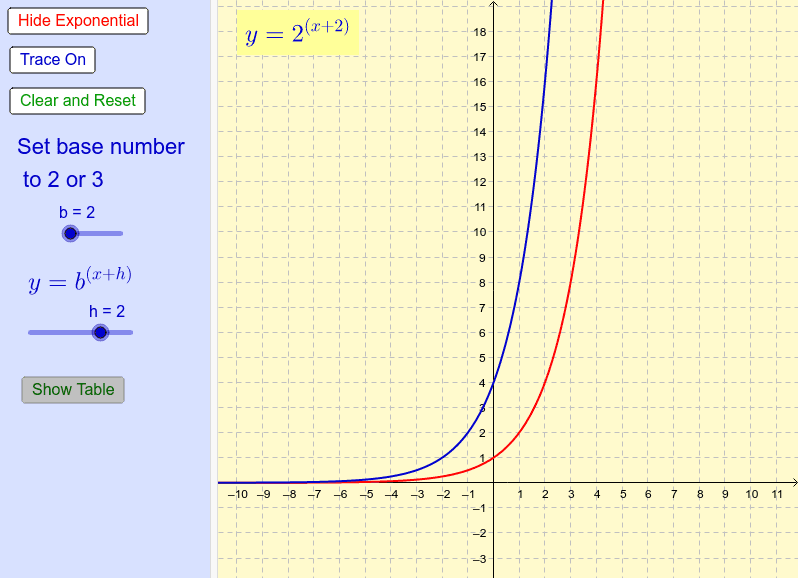
This example demonstrates the effect of adding a constant to the exponent of exponential functions with bases 2 or 3. It covers core math concepts like exponential function properties and graph transformations. Constructed using GeoGebra commands like TableText and objects such as sliders and text elements. Ideal for high school mathematics education to explore transformation rules of exponential function graphs.
GeoGebra Commands & Parameters
TableText({{A1, B1, C1}, {A2, B2, C2}, {A3, B3, C3}, {A4, B4, C4}, {A5, B5, C5}, {A6, B6, C6}, {A7, B7, C7}, {A8, B8, C8}}, "c_|") → text3
AI Drawing Prompt Reference
Create a graph demonstrating transformations of exponential functions with bases 2 and 3, showing how adding a constant to the exponent affects the graph. Use sliders to control the constant added to the exponent, and include text annotations for key points and transformation rules. Display different function expressions and graph changes for various constant values in a table.
The prompt above was compiled from the original drawing commands and is for reference only.