
Exponential Function Model
Loading the math board and drawing, please wait…
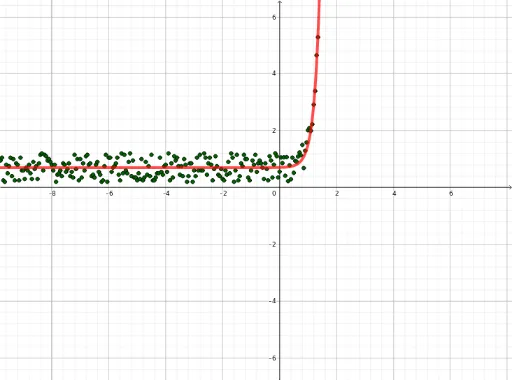
This example demonstrates the graph of an exponential function and its variation patterns. Core math concepts include the properties of exponential functions and the impact of parameters on the function's graph. Construction highlights use of GeoGebra's Sequence and Textfield commands, along with objects like a, b, c, d, f, L_1, etc., to create function models and show parameter changes. Suitable for high school and above learners for understanding exponential function models in probability and statistics applications.
GeoGebra Commands & Parameters
Sequence((i, (a * ℯ^((b * i) - c)) + d + Random[-10, 10] / 20), i, -50, 50, 0.05) → L_1Textfield(a) → CasillaDeEntrada1Textfield(b) → CasillaDeEntrada2Textfield(c) → CasillaDeEntrada3Textfield(d) → CasillaDeEntrada4
AI Drawing Prompt Reference
Draw the graph of an exponential function to show how parameter changes affect its shape. Include a randomly perturbed exponential sequence, and observe the effects of adjusting parameters a, b, c, d on the function's translation, scaling, and decay, suitable for high school and above learners in probability and statistics applications.
The prompt above was compiled from the original drawing commands and is for reference only.