
Exponential Function Grapher: Interactive Exploration of Parameters
Loading the math board and drawing, please wait…
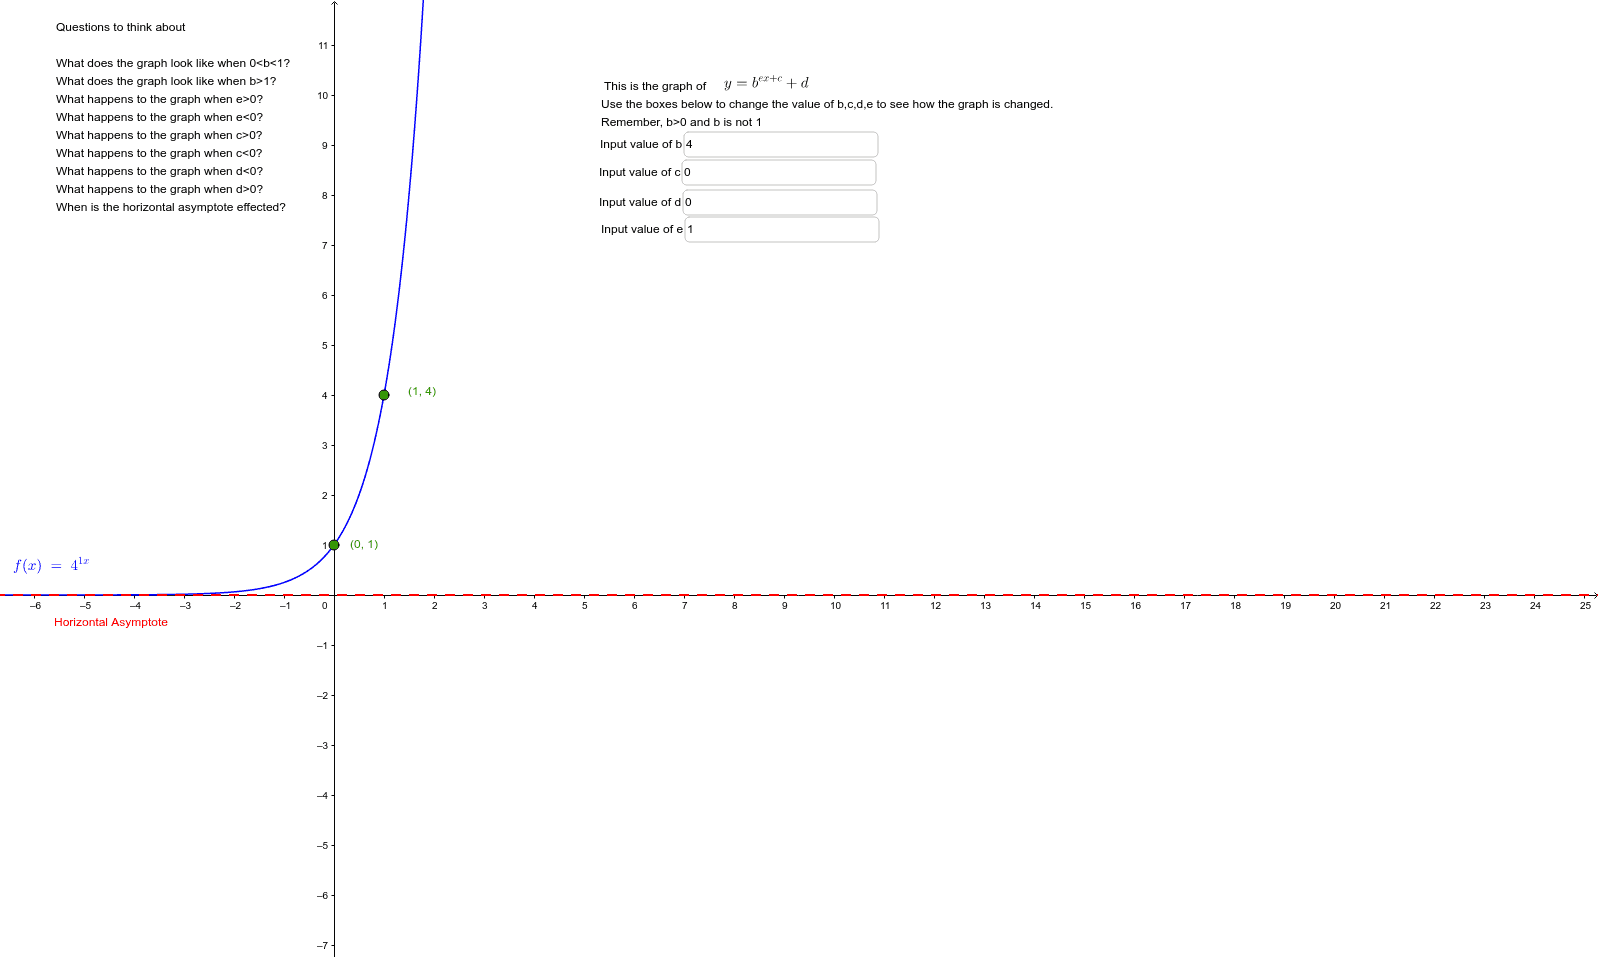
① This interactive tool demonstrates how the graph of an exponential function y = a·b^x + c changes with its parameters, helping users intuitively grasp the visual features of exponential growth and decay. ② Core mathematical concepts include exponential functions, the effect of the base b on increase/decrease, vertical translation c, and intersections with coordinate axes. ③ Construction highlights: GeoGebra's Textfield command creates multiple input boxes (inputBox1 to inputBox4) controlling parameters b, c, d, a, e, f, while text objects (text1 to text4) display the function expression and usage instructions; points A and B may mark key points or intersections. ④ Suitable for high school or pre-university students learning transformations of exponential graphs, and useful for teachers in classroom demonstrations or for students' self-directed exploration, allowing real-time observation of graph changes as parameters are adjusted to deepen understanding of exponential function properties.
GeoGebra Commands & Parameters
Textfield(b) → inputBox1Textfield(c) → inputBox2Textfield(d) → inputBox3Textfield(e) → inputBox4
AI Drawing Prompt Reference
Create an interactive graph of the exponential function y = a·b^x + c, showing how parameters b, c, d, a, e, f affect the graph, including visual features of exponential growth and decay, and intersections with coordinate axes. Use sliders to control parameters, display the function expression and instructions, mark key points, and update the graph in real-time as parameters change.
The prompt above was compiled from the original drawing commands and is for reference only.