
Exponential Function Demo by Neil Bradley
Loading the math board and drawing, please wait…
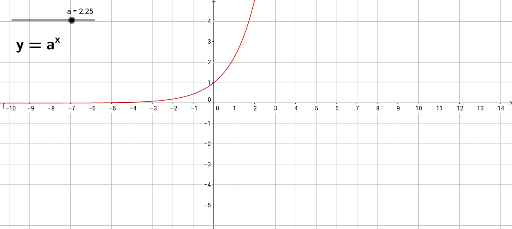
This example demonstrates the graph and behavior of exponential functions, including their properties, transformations, and parameter effects. It uses GeoGebra commands/objects like 'a' (variable), 'text1' (text label), and 'f' (function). Ideal for high school mathematics education to understand exponential function models and applications.
GeoGebra Commands & Parameters
Numeric a(2.25)f(x) = a^(x)
AI Drawing Prompt Reference
Draw an exponential function graph to show the effect of a variable on the function's shape, use 2.25 as the initial value of the variable, and express the function as the variable raised to the power of x, labeling key points and characteristics.
The prompt above was compiled from the original drawing commands and is for reference only.