
Exponential and Logarithmic Relationship Demo
Loading the math board and drawing, please wait…
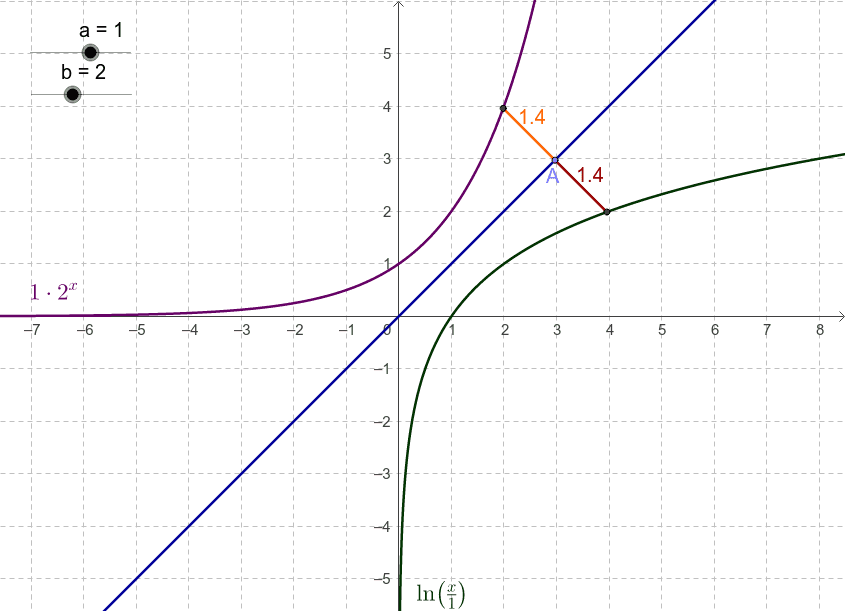
This example visually demonstrates the inverse relationship between exponential and logarithmic functions. It involves core math concepts like exponential functions, logarithmic functions, inverse functions, and function graphs. Construction highlights include using GeoGebra commands/objects such as Point, Line, OrthogonalLine, Intersect, and Segment. Suitable for high school mathematics teaching to help students intuitively understand the inverse properties of exponentials and logs.
GeoGebra Commands & Parameters
Point(g) → APoint(g) → BLine(B, A) → cOrthogonalLine(A, c) → dIntersect(f, d, (1.984876506862981, 3.9582877860003656)) → CIntersect(h, d, (3.9582877876801565, 1.9848765074752222)) → DSegment(A, C) → eSegment(A, D) → i